Matplotlib中许多常用绘图命令的概述。 请注意,我们已经剥离了图表的所有标志,但事实上它们默认存在。有关更多示例,请参见图表陈列库:https://matplotlib.org/stable/gallery/index.html;有关更长的示例,请参阅教程页面:https://matplotlib.org/stable/tutorials/index.html。
一、基本的类型
基本绘图类型通常使用y和x坐标轴。
plot(x, y) 线型图,参考plot:https://matplotlib.org/stable/api/_as_gen/matplotlib.axes.Axes.plot.html#matplotlib.axes.Axes.plot
·
·
·
·
·
·
·
·
·
·
·
·
·
·
·
·
·
·
import matplotlib.pyplot as pltimport numpy as np
plt.style.use('_mpl-gallery')
# make datax = np.linspace(0, 10, 100)y = 4 + 2 * np.sin(2 * x)
# plotfig, ax = plt.subplots()
ax.plot(x, y, linewidth=2.0)
ax.set(xlim=(0, 8), xticks=np.arange(1, 8), ylim=(0, 8), yticks=np.arange(1, 8))
plt.show()
scatter(x, y) 散点图,参考scatter:https://matplotlib.org/stable/api/_as_gen/matplotlib.axes.Axes.scatter.html#matplotlib.axes.Axes.scatter
·
·
·
·
·
·
·
·
·
·
·
·
·
·
·
·
·
·
·
·
·
·
import matplotlib.pyplot as pltimport numpy as np
plt.style.use('_mpl-gallery')
# make the datanp.random.seed(3)x = 4 + np.random.normal(0, 2, 24)y = 4 + np.random.normal(0, 2, len(x))# size and color:sizes = np.random.uniform(15, 80, len(x))colors = np.random.uniform(15, 80, len(x))
# plotfig, ax = plt.subplots()
ax.scatter(x, y, s=sizes, c=colors, vmin=0, vmax=100)
ax.set(xlim=(0, 8), xticks=np.arange(1, 8), ylim=(0, 8), yticks=np.arange(1, 8))
plt.show()
bar(x, height) 条形图,参考bar:https://matplotlib.org/stable/api/_as_gen/matplotlib.axes.Axes.bar.html#matplotlib.axes.Axes.bar
·
·
·
·
·
·
·
·
·
·
·
·
·
·
·
·
·
·
import matplotlib.pyplot as pltimport numpy as npplt.style.use('_mpl-gallery')
# make data:np.random.seed(3)x = 0.5 + np.arange(8)y = np.random.uniform(2, 7, len(x))
# plotfig, ax = plt.subplots()
ax.bar(x, y, width=1, edgecolor="white", linewidth=0.7)
ax.set(xlim=(0, 8), xticks=np.arange(1, 8), ylim=(0, 8), yticks=np.arange(1, 8))
plt.show()
stem(x, y) 阀杆图,参考stem:https://matplotlib.org/stable/api/_as_gen/matplotlib.axes.Axes.stem.html#matplotlib.axes.Axes.stem。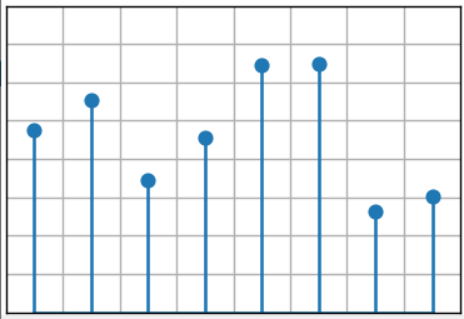
·
·
·
·
·
·
·
·
·
·
·
·
·
·
·
·
·
·
·
import matplotlib.pyplot as pltimport numpy as np
plt.style.use('_mpl-gallery')
# make datanp.random.seed(3)x = 0.5 + np.arange(8)y = np.random.uniform(2, 7, len(x))
# plotfig, ax = plt.subplots()
ax.stem(x, y)
ax.set(xlim=(0, 8), xticks=np.arange(1, 8), ylim=(0, 8), yticks=np.arange(1, 8))
plt.show()
step(x, y) 阶梯图,参看step:https://matplotlib.org/stable/api/_as_gen/matplotlib.axes.Axes.step.html#matplotlib.axes.Axes.step。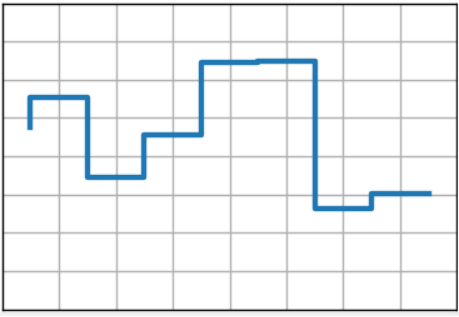
·
·
·
·
·
·
·
·
·
·
·
·
·
·
·
·
·
·
·
import matplotlib.pyplot as pltimport numpy as np
plt.style.use('_mpl-gallery')
# make datanp.random.seed(3)x = 0.5 + np.arange(8)y = np.random.uniform(2, 7, len(x))
# plotfig, ax = plt.subplots()
ax.step(x, y, linewidth=2.5)
ax.set(xlim=(0, 8), xticks=np.arange(1, 8), ylim=(0, 8), yticks=np.arange(1, 8))
plt.show()
fill_between(x, y1, y2) 中间填充图,参看fill_between:https://matplotlib.org/stable/api/_as_gen/matplotlib.axes.Axes.fill_between.html#matplotlib.axes.Axes.fill_between。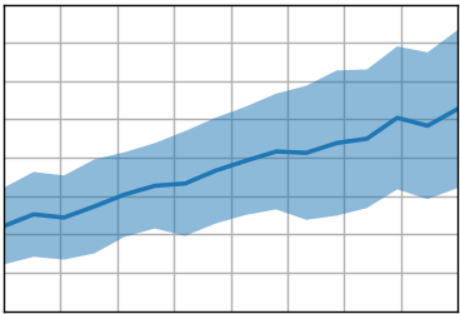
·
·
·
·
·
·
·
·
·
·
·
·
·
·
·
·
·
·
·
·
·
import matplotlib.pyplot as pltimport numpy as np
plt.style.use('_mpl-gallery')
# make datanp.random.seed(1)x = np.linspace(0, 8, 16)y1 = 3 + 4*x/8 + np.random.uniform(0.0, 0.5, len(x))y2 = 1 + 2*x/8 + np.random.uniform(0.0, 0.5, len(x))
# plotfig, ax = plt.subplots()
ax.fill_between(x, y1, y2, alpha=.5, linewidth=0)ax.plot(x, (y1 + y2)/2, linewidth=2)
ax.set(xlim=(0, 8), xticks=np.arange(1, 8), ylim=(0, 8), yticks=np.arange(1, 8))
plt.show()
stackplot(x, y) 叠加图,参看stackplot:https://matplotlib.org/stable/api/_as_gen/matplotlib.axes.Axes.stackplot.html#matplotlib.axes.Axes.stackplot。
·
·
·
·
·
·
·
·
·
·
·
·
·
·
·
·
·
·
·
·
·
import matplotlib.pyplot as pltimport numpy as np
plt.style.use('_mpl-gallery')
# make datax = np.arange(0, 10, 2)ay = [1, 1.25, 2, 2.75, 3]by = [1, 1, 1, 1, 1]cy = [2, 1, 2, 1, 2]y = np.vstack([ay, by, cy])
# plotfig, ax = plt.subplots()
ax.stackplot(x, y)
ax.set(xlim=(0, 8), xticks=np.arange(1, 8), ylim=(0, 8), yticks=np.arange(1, 8))
plt.show()
二、绘制阵平面图和域平面图 绘制一个数组的图形,这个数组的元素是平面坐标(x, y)的函数;在一个平面内绘制两个以坐标(x, y)为自变量的函数U和V的分布图。
imshow(Z) 方格图,参看imshow:https://matplotlib.org/stable/api/_as_gen/matplotlib.axes.Axes.imshow.html#matplotlib.axes.Axes.imshow。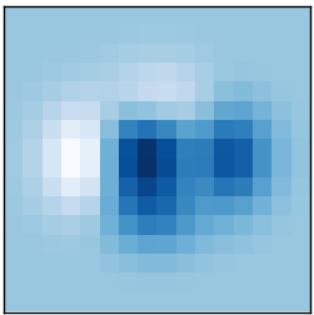
·
·
·
·
·
·
·
·
·
·
·
·
·
·
·
import matplotlib.pyplot as pltimport numpy as np
plt.style.use('_mpl-gallery-nogrid')
# make dataX, Y = np.meshgrid(np.linspace(-3, 3, 16), np.linspace(-3, 3, 16))Z = (1 - X/2 + X**5 + Y**3) * np.exp(-X**2 - Y**2)
# plotfig, ax = plt.subplots()
ax.imshow(Z)
plt.show()
pcolormesh (X, Y, Z) pcolormesh比imshow更灵活,因为x和y向量不需要等间距(实际上它们可以倾斜)。参看pcolormesh:https://matplotlib.org/stable/api/_as_gen/matplotlib.axes.Axes.pcolormesh.html#matplotlib.axes.Axes.pcolormesh。
·
·
·
·
·
·
·
·
·
·
·
·
·
·
·
·
import matplotlib.pyplot as pltimport numpy as np
plt.style.use('_mpl-gallery-nogrid')
# make data with uneven sampling in xx = [-3, -2, -1.6, -1.2, -.8, -.5, -.2, .1, .3, .5, .8, 1.1, 1.5, 1.9, 2.3, 3]X, Y = np.meshgrid(x, np.linspace(-3, 3, 128))Z = (1 - X/2 + X**5 + Y**3) * np.exp(-X**2 - Y**2)
# plotfig, ax = plt.subplots()
ax.pcolormesh(X, Y, Z, vmin=-0.5, vmax=1.0)
plt.show()
contour(X, Y, Z) 轮廓图,参看contour:https://matplotlib.org/stable/api/_as_gen/matplotlib.axes.Axes.contour.html#matplotlib.axes.Axes.contour。
·
·
·
·
·
·
·
·
·
·
·
·
·
·
·
·
import matplotlib.pyplot as pltimport numpy as np
plt.style.use('_mpl-gallery-nogrid')
# make dataX, Y = np.meshgrid(np.linspace(-3, 3, 256), np.linspace(-3, 3, 256))Z = (1 - X/2 + X**5 + Y**3) * np.exp(-X**2 - Y**2)levels = np.linspace(np.min(Z), np.max(Z), 7)
# plotfig, ax = plt.subplots()
ax.contour(X, Y, Z, levels=levels)
plt.show()
contourf(X, Y, Z) 填充轮廓图,参看contourf:https://matplotlib.org/stable/api/_as_gen/matplotlib.axes.Axes.contourf.html#matplotlib.axes.Axes.contourf。
·
·
·
·
·
·
·
·
·
·
·
·
·
·
·
·
import matplotlib.pyplot as pltimport numpy as np
plt.style.use('_mpl-gallery-nogrid')
# make dataX, Y = np.meshgrid(np.linspace(-3, 3, 256), np.linspace(-3, 3, 256))Z = (1 - X/2 + X**5 + Y**3) * np.exp(-X**2 - Y**2)levels = np.linspace(Z.min(), Z.max(), 7)
# plotfig, ax = plt.subplots()
ax.contourf(X, Y, Z, levels=levels)
plt.show()
barbs(X, Y, U, V) 倒钩图,参看barbs:https://matplotlib.org/stable/api/_as_gen/matplotlib.axes.Axes.barbs.html#matplotlib.axes.Axes.barbs。
·
·
·
·
·
·
·
·
·
·
·
·
·
·
·
·
·
·
·
·
·
·
·
·
·
·
import matplotlib.pyplot as pltimport numpy as np
plt.style.use('_mpl-gallery-nogrid')
# make data:X, Y = np.meshgrid([1, 2, 3, 4], [1, 2, 3, 4])angle = np.pi / 180 * np.array([[15., 30, 35, 45], [25., 40, 55, 60], [35., 50, 65, 75], [45., 60, 75, 90]])amplitude = np.array([[5, 10, 25, 50], [10, 15, 30, 60], [15, 26, 50, 70], [20, 45, 80, 100]])U = amplitude * np.sin(angle)V = amplitude * np.cos(angle)
# plot:fig, ax = plt.subplots()
ax.barbs(X, Y, U, V, barbcolor='C0', flagcolor='C0', length=7, linewidth=1.5)
ax.set(xlim=(0, 4.5), ylim=(0, 4.5))
plt.show()
quiver(X, Y, U, V) 颤动图,参看quiver:https://matplotlib.org/stable/api/_as_gen/matplotlib.axes.Axes.quiver.html#matplotlib.axes.Axes.quiver。
·
·
·
·
·
·
·
·
·
·
·
·
·
·
·
·
·
·
·
·
·
import matplotlib.pyplot as pltimport numpy as np
plt.style.use('_mpl-gallery-nogrid')
# make datax = np.linspace(-4, 4, 6)y = np.linspace(-4, 4, 6)X, Y = np.meshgrid(x, y)U = X + YV = Y - X
# plotfig, ax = plt.subplots()
ax.quiver(X, Y, U, V, color="C0", angles='xy', scale_units='xy', scale=5, width=.015)
ax.set(xlim=(-5, 5), ylim=(-5, 5))
plt.show()
streamplot(X, Y, U, V) 流线图,参看streamplot:https://matplotlib.org/stable/api/_as_gen/matplotlib.axes.Axes.streamplot.html#matplotlib.axes.Axes.streamplot。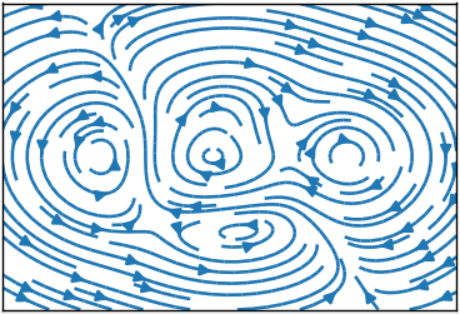
·
·
·
·
·
·
·
·
·
·
·
·
·
·
·
·
·
·
import matplotlib.pyplot as pltimport numpy as np
plt.style.use('_mpl-gallery-nogrid')
# make a stream function:X, Y = np.meshgrid(np.linspace(-3, 3, 256), np.linspace(-3, 3, 256))Z = (1 - X/2 + X**5 + Y**3) * np.exp(-X**2 - Y**2)# make U and V out of the streamfunction:V = np.diff(Z[1:, :], axis=1)U = -np.diff(Z[:, 1:], axis=0)
# plot:fig, ax = plt.subplots()
ax.streamplot(X[1:, 1:], Y[1:, 1:], U, V)
plt.show()
三、统计图 用于统计分析的绘图。
hist(x) 柱状图,参看hist:https://matplotlib.org/stable/api/_as_gen/matplotlib.axes.Axes.hist.html#matplotlib.axes.Axes.hist。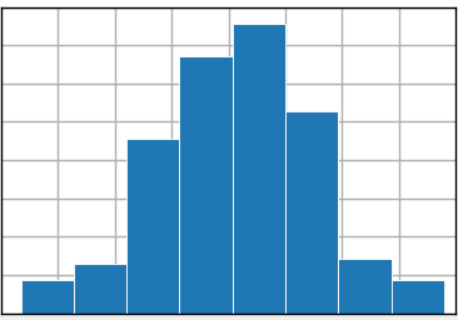
·
·
·
·
·
·
·
·
·
·
·
·
·
·
·
·
·
·
import matplotlib.pyplot as pltimport numpy as np
plt.style.use('_mpl-gallery')
# make datanp.random.seed(1)x = 4 + np.random.normal(0, 1.5, 200)
# plot:fig, ax = plt.subplots()
ax.hist(x, bins=8, linewidth=0.5, edgecolor="white")
ax.set(xlim=(0, 8), xticks=np.arange(1, 8), ylim=(0, 56), yticks=np.linspace(0, 56, 9))
plt.show()
boxplot(X) 方框图,参看boxplot:https://matplotlib.org/stable/api/_as_gen/matplotlib.axes.Axes.boxplot.html#matplotlib.axes.Axes.boxplot。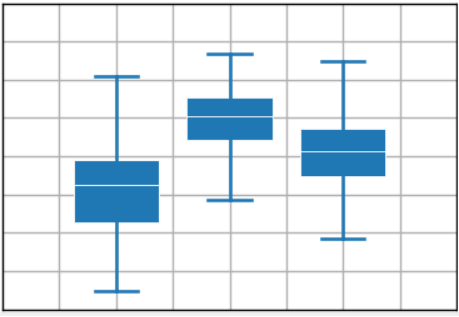
·
·
·
·
·
·
·
·
·
·
·
·
·
·
·
·
·
·
·
·
·
·
·
import matplotlib.pyplot as pltimport numpy as np
plt.style.use('_mpl-gallery')
# make data:np.random.seed(10)D = np.random.normal((3, 5, 4), (1.25, 1.00, 1.25), (100, 3))
# plotfig, ax = plt.subplots()VP = ax.boxplot(D, positions=[2, 4, 6], widths=1.5, patch_artist=True, showmeans=False, showfliers=False, medianprops={"color": "white", "linewidth": 0.5}, boxprops={"facecolor": "C0", "edgecolor": "white", "linewidth": 0.5}, whiskerprops={"color": "C0", "linewidth": 1.5}, capprops={"color": "C0", "linewidth": 1.5})
ax.set(xlim=(0, 8), xticks=np.arange(1, 8), ylim=(0, 8), yticks=np.arange(1, 8))
plt.show()
errorbar(x, y, yerr, xerr) 误差条图,参看errorbar:https://matplotlib.org/stable/api/_as_gen/matplotlib.axes.Axes.errorbar.html#matplotlib.axes.Axes.errorbar。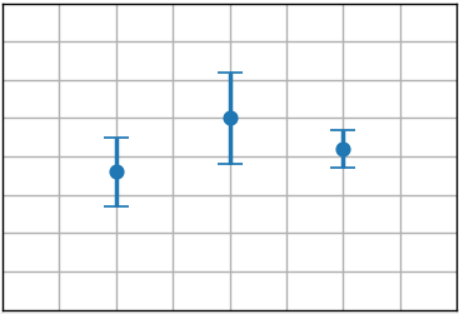
·
·
·
·
·
·
·
·
·
·
·
·
·
·
·
·
·
·
·
·
import matplotlib.pyplot as pltimport numpy as np
plt.style.use('_mpl-gallery')
# make data:np.random.seed(1)x = [2, 4, 6]y = [3.6, 5, 4.2]yerr = [0.9, 1.2, 0.5]
# plot:fig, ax = plt.subplots()
ax.errorbar(x, y, yerr, fmt='o', linewidth=2, capsize=6)
ax.set(xlim=(0, 8), xticks=np.arange(1, 8), ylim=(0, 8), yticks=np.arange(1, 8))
plt.show()
violinplot(D) 小提琴谱式图,参看violinplot:https://matplotlib.org/stable/api/_as_gen/matplotlib.axes.Axes.violinplot.html#matplotlib.axes.Axes.violinplot。
·
·
·
·
·
·
·
·
·
·
·
·
·
·
·
·
·
·
·
·
·
import matplotlib.pyplot as pltimport numpy as np
plt.style.use('_mpl-gallery')
# make data:np.random.seed(10)D = np.random.normal((3, 5, 4), (0.75, 1.00, 0.75), (200, 3))
# plot:fig, ax = plt.subplots()
vp = ax.violinplot(D, [2, 4, 6], widths=2, showmeans=False, showmedians=False, showextrema=False)# styling:for body in vp['bodies']: body.set_alpha(0.9)ax.set(xlim=(0, 8), xticks=np.arange(1, 8), ylim=(0, 8), yticks=np.arange(1, 8))
plt.show()
eventplot(D) 事件图,参看eventplot:https://matplotlib.org/stable/api/_as_gen/matplotlib.axes.Axes.eventplot.html#matplotlib.axes.Axes.eventplot。
·
·
·
·
·
·
·
·
·
·
·
·
·
·
·
·
·
·
·
import matplotlib.pyplot as pltimport numpy as np
plt.style.use('_mpl-gallery')
# make data:np.random.seed(1)x = [2, 4, 6]D = np.random.gamma(4, size=(3, 50))
# plot:fig, ax = plt.subplots()
ax.eventplot(D, orientation="vertical", lineoffsets=x, linewidth=0.75)
ax.set(xlim=(0, 8), xticks=np.arange(1, 8), ylim=(0, 8), yticks=np.arange(1, 8))
plt.show()
hist2d(x, y) 方箱图,参看hist2d:https://matplotlib.org/stable/api/_as_gen/matplotlib.axes.Axes.hist2d.html#matplotlib.axes.Axes.hist2d。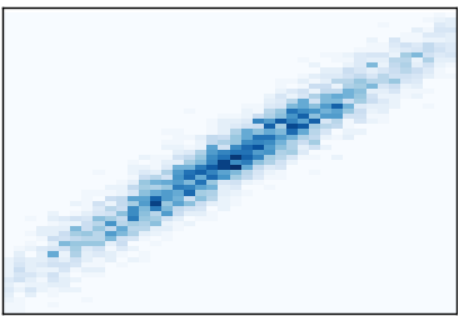
·
·
·
·
·
·
·
·
·
·
·
·
·
·
·
·
·
·
import matplotlib.pyplot as pltimport numpy as np
plt.style.use('_mpl-gallery-nogrid')
# make data: correlated + noisenp.random.seed(1)x = np.random.randn(5000)y = 1.2 * x + np.random.randn(5000) / 3
# plot:fig, ax = plt.subplots()
ax.hist2d(x, y, bins=(np.arange(-3, 3, 0.1), np.arange(-3, 3, 0.1)))
ax.set(xlim=(-2, 2), ylim=(-3, 3))
plt.show()
hexbin(x, y, C) 六角箱图,参看hexbin:https://matplotlib.org/stable/api/_as_gen/matplotlib.axes.Axes.hexbin.html#matplotlib.axes.Axes.hexbin。
·
·
·
·
·
·
·
·
·
·
·
·
·
·
·
·
·
·
import matplotlib.pyplot as pltimport numpy as np
plt.style.use('_mpl-gallery-nogrid')
# make data: correlated + noisenp.random.seed(1)x = np.random.randn(5000)y = 1.2 * x + np.random.randn(5000) / 3
# plot:fig, ax = plt.subplots()
ax.hexbin(x, y, gridsize=20)
ax.set(xlim=(-2, 2), ylim=(-3, 3))
plt.show()
pie(x) 饼图,参看pie:https://matplotlib.org/stable/api/_as_gen/matplotlib.axes.Axes.pie.html#matplotlib.axes.Axes.pie。
·
·
·
·
·
·
·
·
·
·
·
·
·
·
·
·
·
·
·
import matplotlib.pyplot as pltimport numpy as np
plt.style.use('_mpl-gallery-nogrid')
# make datax = [1, 2, 3, 4]colors = plt.get_cmap('Blues')(np.linspace(0.2, 0.7, len(x)))
# plotfig, ax = plt.subplots()ax.pie(x, colors=colors, radius=3, center=(4, 4), wedgeprops={"linewidth": 1, "edgecolor": "white"}, frame=True)
ax.set(xlim=(0, 8), xticks=np.arange(1, 8), ylim=(0, 8), yticks=np.arange(1, 8))
plt.show()
四、非结构化坐标图 有时我们在坐标(x,y)处收集数据z,并希望将其可视化为轮廓。我们可以使用三角剖分算法来填充三角形,而不是先对数据进行网格化,然后使用等高线。
tricontour(x, y, z) 三角剖分图,参看tricontour:https://matplotlib.org/stable/api/_as_gen/matplotlib.axes.Axes.tricontour.html#matplotlib.axes.Axes.tricontour
·
·
·
·
·
·
·
·
·
·
·
·
·
·
·
·
·
·
·
·
·
import matplotlib.pyplot as pltimport numpy as np
plt.style.use('_mpl-gallery-nogrid')
# make data:np.random.seed(1)x = np.random.uniform(-3, 3, 256)y = np.random.uniform(-3, 3, 256)z = (1 - x/2 + x**5 + y**3) * np.exp(-x**2 - y**2)levels = np.linspace(z.min(), z.max(), 7)
# plot:fig, ax = plt.subplots()
ax.plot(x, y, 'o', markersize=2, color='lightgrey')ax.tricontour(x, y, z, levels=levels)
ax.set(xlim=(-3, 3), ylim=(-3, 3))
plt.show()
tricontourf(x, y, z) 填充三角剖分图,参看tricontourf:https://matplotlib.org/stable/api/_as_gen/matplotlib.axes.Axes.tricontourf.html#matplotlib.axes.Axes.tricontourf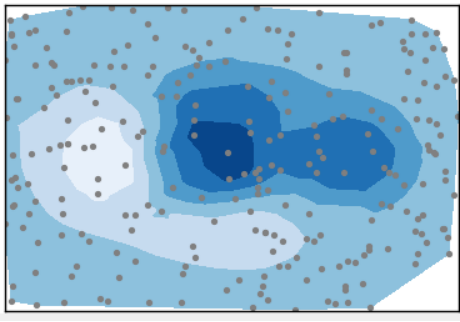
·
·
·
·
·
·
·
·
·
·
·
·
·
·
·
·
·
·
·
·
·
import matplotlib.pyplot as pltimport numpy as np
plt.style.use('_mpl-gallery-nogrid')
# make data:np.random.seed(1)x = np.random.uniform(-3, 3, 256)y = np.random.uniform(-3, 3, 256)z = (1 - x/2 + x**5 + y**3) * np.exp(-x**2 - y**2)levels = np.linspace(z.min(), z.max(), 7)
# plot:fig, ax = plt.subplots()
ax.plot(x, y, 'o', markersize=2, color='grey')ax.tricontourf(x, y, z, levels=levels)
ax.set(xlim=(-3, 3), ylim=(-3, 3))
plt.show()
triplot(x, y) 三角网络图,参看triplot:https://matplotlib.org/stable/api/_as_gen/matplotlib.axes.Axes.triplot.html#matplotlib.axes.Axes.triplot
·
·
·
·
·
·
·
·
·
·
·
·
·
·
·
·
·
·
·
import matplotlib.pyplot as pltimport numpy as np
plt.style.use('_mpl-gallery-nogrid')
# make data:np.random.seed(1)x = np.random.uniform(-3, 3, 256)y = np.random.uniform(-3, 3, 256)z = (1 - x/2 + x**5 + y**3) * np.exp(-x**2 - y**2)
# plot:fig, ax = plt.subplots()
ax.triplot(x, y)
ax.set(xlim=(-3, 3), ylim=(-3, 3))
plt.show()
五、三维图表
3D图表用mpl_toolkits.mplot3d库:https://matplotlib.org/stable/api/toolkits/mplot3d.html#module-mpl_toolkits.mplot3d
3D scatterplot 三维散点图,参看scatter:https://matplotlib.org/stable/api/_as_gen/mpl_toolkits.mplot3d.axes3d.Axes3D.html#mpl_toolkits.mplot3d.axes3d.Axes3D.scatter
·
·
·
·
·
·
·
·
·
·
·
·
·
·
·
·
·
·
·
·
·
·
import matplotlib.pyplot as pltimport numpy as np
plt.style.use('_mpl-gallery')
# Make datanp.random.seed(19680801)n = 100rng = np.random.default_rng()xs = rng.uniform(23, 32, n)ys = rng.uniform(0, 100, n)zs = rng.uniform(-50, -25, n)
# Plotfig, ax = plt.subplots(subplot_kw={"projection": "3d"})ax.scatter(xs, ys, zs)
ax.set(xticklabels=[], yticklabels=[], zticklabels=[])
plt.show()
3D surface 3D曲面图,参看plot_surface:https://matplotlib.org/stable/api/_as_gen/mpl_toolkits.mplot3d.axes3d.Axes3D.html#mpl_toolkits.mplot3d.axes3d.Axes3D.plot_surface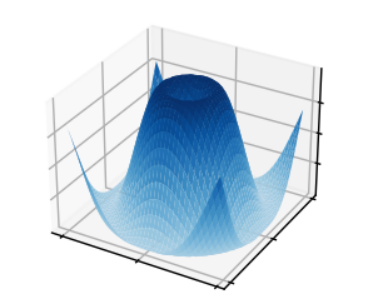
·
·
·
·
·
·
·
·
·
·
·
·
·
·
·
·
·
·
·
·
·
·
import matplotlib.pyplot as pltfrom matplotlib import cmimport numpy as np
plt.style.use('_mpl-gallery')
# Make dataX = np.arange(-5, 5, 0.25)Y = np.arange(-5, 5, 0.25)X, Y = np.meshgrid(X, Y)R = np.sqrt(X**2 + Y**2)Z = np.sin(R)
# Plot the surfacefig, ax = plt.subplots(subplot_kw={"projection": "3d"})ax.plot_surface(X, Y, Z, vmin=Z.min() * 2, cmap=cm.Blues)
ax.set(xticklabels=[], yticklabels=[], zticklabels=[])
plt.show()
Triangular 3D surfaces 鞍形图,参看plot_trisurf:https://matplotlib.org/stable/api/_as_gen/mpl_toolkits.mplot3d.axes3d.Axes3D.html#mpl_toolkits.mplot3d.axes3d.Axes3D.plot_trisurf
·
·
·
·
·
·
·
·
·
·
·
·
·
·
·
·
·
·
·
·
·
·
·
·
·
·
·
import matplotlib.pyplot as pltfrom matplotlib import cmimport numpy as np
plt.style.use('_mpl-gallery')
n_radii = 8n_angles = 36
# Make radii and angles spacesradii = np.linspace(0.125, 1.0, n_radii)angles = np.linspace(0, 2*np.pi, n_angles, endpoint=False)[..., np.newaxis]
# Convert polar (radii, angles) coords to cartesian (x, y) coords.x = np.append(0, (radii*np.cos(angles)).flatten())y = np.append(0, (radii*np.sin(angles)).flatten())z = np.sin(-x*y)
# Plotfig, ax = plt.subplots(subplot_kw={'projection': '3d'})ax.plot_trisurf(x, y, z, vmin=z.min() * 2, cmap=cm.Blues)
ax.set(xticklabels=[], yticklabels=[], zticklabels=[])
plt.show()
3D voxel / volumetric plot 三维体积/容积图,参看voxels:https://matplotlib.org/stable/api/_as_gen/mpl_toolkits.mplot3d.axes3d.Axes3D.html#mpl_toolkits.mplot3d.axes3d.Axes3D.voxels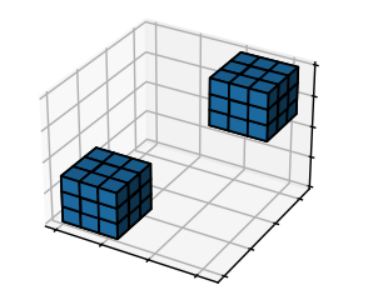
·
·
·
·
·
·
·
·
·
·
·
·
·
·
·
·
·
·
·
·
·
·
·
·
import matplotlib.pyplot as pltimport numpy as np
plt.style.use('_mpl-gallery')
# Prepare some coordinatesx, y, z = np.indices((8, 8, 8))
# Draw cuboids in the top left and bottom right cornerscube1 = (x < 3) & (y < 3) & (z < 3)cube2 = (x >= 5) & (y >= 5) & (z >= 5)
# Combine the objects into a single boolean arrayvoxelarray = cube1 | cube2
# Plotfig, ax = plt.subplots(subplot_kw={"projection": "3d"})ax.voxels(voxelarray, edgecolor='k')
ax.set(xticklabels=[], yticklabels=[], zticklabels=[])
plt.show()
3D wireframe plot 三维线框图,参看plot_wireframe:https://matplotlib.org/stable/api/_as_gen/mpl_toolkits.mplot3d.axes3d.Axes3D.html#mpl_toolkits.mplot3d.axes3d.Axes3D.plot_wireframe。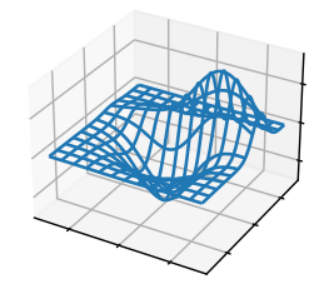
·
·
·
·
·
·
·
·
·
·
·
·
·
·
·
·
·
from mpl_toolkits.mplot3d import axes3dimport matplotlib.pyplot as plt
plt.style.use('_mpl-gallery')
# Make dataX, Y, Z = axes3d.get_test_data(0.05)
# Plotfig, ax = plt.subplots(subplot_kw={"projection": "3d"})ax.plot_wireframe(X, Y, Z, rstride=10, cstride=10)
ax.set(xticklabels=[], yticklabels=[], zticklabels=[])
plt.show()