绘图函数的输入参数类型
绘图函数需要numpy.array或numpy.ma.masked_array作为输入,或可以传递给numpy.asarray的对象。类似于数组(“array-like”)的类(如pandas数据对象和numpy.matrix)可能无法按预期工作。常见的惯例是在绘图之前将这些对象转换为numpy.array对象。例如,要转换numpy.matrix
·
·
b = np.matrix([[1, 2], [3, 4]])b_asarray = np.asarray(b)
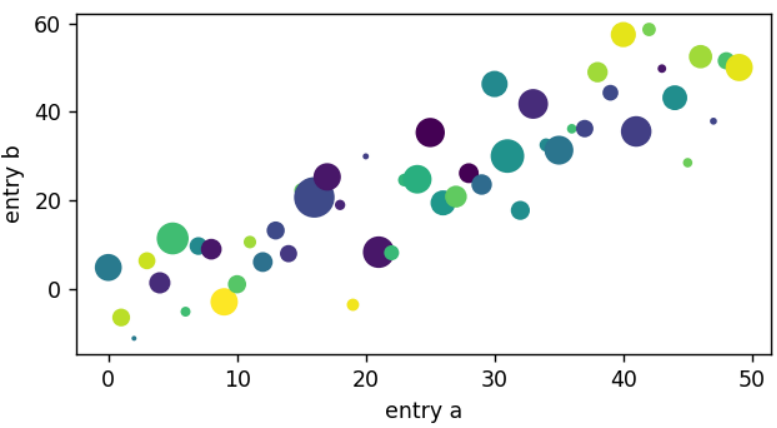
大多数方法还将解析可寻址对象,如dict、numpy.recarray或pandas.DataFrame。Matplotlib允许您提供数据关键字参数并生成传递与x和y变量对应的字符串的绘图。
·
·
·
·
·
·
·
·
·
·
·
·
·
import matplotlib.pyplot as pltimport numpy as npnp.random.seed(19680801) # seed the random number generator.data = {'a': np.arange(50), 'c': np.random.randint(0, 50, 50), 'd': np.random.randn(50)}data['b'] = data['a'] + 10 * np.random.randn(50)data['d'] = np.abs(data['d']) * 100fig, ax = plt.subplots(figsize=(5, 2.7), layout='constrained')ax.scatter('a', 'b', c='c', s='d', data=data)ax.set_xlabel('entry a')ax.set_ylabel('entry b')fig.show()

编码风格——显式和隐式接口
如上所述,使用Matplotlib主要有两种方法:
● 显式创建Figures和Axes,并在调用它们的方法(“面向对象(OO)风格”)。
● 依靠pyplot隐式创建和管理Figures和Axes,并使用pyplot函数进行绘图。
请参见Matplotlib应用程序接口(APIs),了解隐式和显式接口之间的不同,以权衡取舍:
https://matplotlib.org/stable/users/explain/api_interfaces.html#api-interfaces
所以,下面的例子既可以使用OO风格:
·
·
·
·
·
·
·
·
·
·
·
·
·
·
import matplotlib.pyplot as pltimport numpy as npnp.random.seed(19680801) # seed the random number generator.x = np.linspace(0, 2, 100) # Sample data.# Note that even in the OO-style, we use `.pyplot.figure` to create the Figure.fig, ax = plt.subplots(figsize=(5, 2.7), layout='constrained')ax.plot(x, x, label='linear') # Plot some data on the axes.ax.plot(x, x**2, label='quadratic') # Plot more data on the axes...ax.plot(x, x**3, label='cubic') # ... and some more.ax.set_xlabel('x label') # Add an x-label to the axes.ax.set_ylabel('y label') # Add a y-label to the axes.ax.set_title("Simple Plot") # Add a title to the axes.ax.legend() # Add a legend.fig.show()

也可以用pyplot风格:
·
·
·
·
·
·
·
·
·
·
·
·
·
import matplotlib.pyplot as pltimport numpy as npnp.random.seed(19680801) # seed the random number generator.x = np.linspace(0, 2, 100) # Sample data.plt.figure(figsize=(5, 2.7), layout='constrained')plt.plot(x, x, label='linear') # Plot some data on the (implicit) axes.plt.plot(x, x**2, label='quadratic') # etc.plt.plot(x, x**3, label='cubic')plt.xlabel('x label')plt.ylabel('y label')plt.title("Simple Plot")plt.legend()plt.show()

(此外,还有第三种方法,例如在GUI应用程序中嵌入Matplotlib,即使是创建图形,也会使pyplot完全失效。有关更多信息,请参阅库中的相应部分:在图形用户界面中嵌入Matplotlib:https://matplotlib.org/stable/gallery/user_interfaces/index.html#user-interfaces
。)
Matplotlib的文档和示例同时使用OO和pyplot风格。一般来说,我们建议使用OO风格,尤其是复杂的绘图,以及作为大型项目的重用部分——函数和脚本。不过,对于快速交互的工作,用pyplot风格非常方便。
注意: 一些旧示例,通过from pylab import*使用pylab接口,这种方法已被坚决弃用。
生成助手函数
如果需要使用不同的数据集反复绘制相同的图表,或者想简易包装Matplotlib方法,推荐使用类似下面签名的函数。
·
·
·
·
·
·
·
·
·
import matplotlib.pyplot as pltimport numpy as npnp.random.seed(19680801) # seed the random number generator.def my_plotter(ax, data1, data2, param_dict): """ A helper function to make a graph. """ out = ax.plot(data1, data2, **param_dict) return out
基于上面的函数,然后可以绘制两个子图表:
·
·
·
·
·
data1, data2, data3, data4 = np.random.randn(4, 100) # make 4 random data setsfig, (ax1, ax2) = plt.subplots(1, 2, figsize=(5, 2.7))my_plotter(ax1, data1, data2, {'marker': 'x'})my_plotter(ax2, data3, data4, {'marker': 'o'});fig.show()

请注意,如果想将这些助手函数作为python的安装包或任何其他定制,可以使用互联网上的许多模板之一;Matplotlib在mpl_cookiecutter就有一个:https://github.com/matplotlib/matplotlib-extension-cookiecutter。