造型艺术家(Styling Artists)
大多数绘图方法都有艺术家的样式选项,可以在调用绘图方法时设置,也可以用艺术家的“setter”方法设置。在下面的绘图中,首先通过手动输入plot的绘图颜色(color)、线宽(linewidth)和线条样式(linestyle)参数来创建艺术家;下一个plot少输入线条样式(linestyle)参数创建艺术家后,用它的set_linestyle来设置线条样式。
·
·
·
·
·
·
·
·
·
·
import matplotlib.pyplot as pltimport numpy as npnp.random.seed(19680801) # seed the random number generator.data1, data2 = np.random.randn(2, 100) # make 2 random data setsfig, ax = plt.subplots(figsize=(5, 2.7))x = np.arange(len(data1))ax.plot(x, np.cumsum(data1), color='blue', linewidth=3, linestyle='--')l, = ax.plot(x, np.cumsum(data2), color='orange', linewidth=2)l.set_linestyle(':');fig.show()

颜色(Colors)
Matplotlib有一个非常灵活的颜色组,大多数艺术家都支持它;有关它的明细列表,请参阅颜色教程:
https://matplotlib.org/stable/tutorials/colors/colors.html。
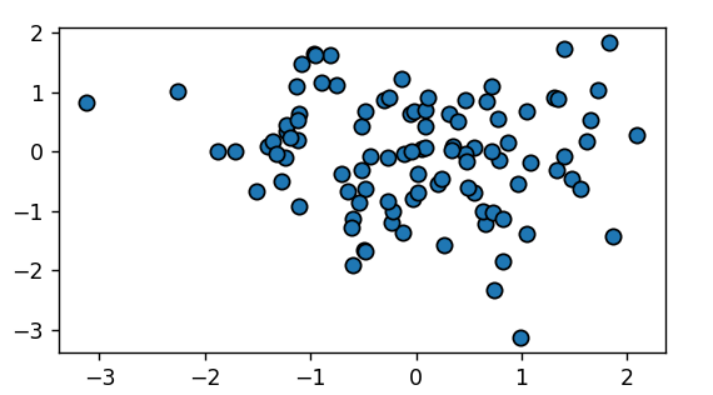
有些艺术家会采用多种颜色。例如散点图,标记的边缘与内部可以有不同的颜色:
·
·
·
·
·
·
·
import matplotlib.pyplot as pltimport numpy as npnp.random.seed(19680801) # seed the random number generator.data1, data2 = np.random.randn(2, 100) # make 2 random data setsfig, ax = plt.subplots(figsize=(5, 2.7))ax.scatter(data1, data2, s=50, facecolor='C0', edgecolor='k');fig.show()

线宽(linewidths)、线型(linestyles)和标记大小(markersizes)
线条宽度的单位通常为印刷点(1 pt=1/72英寸),可用于具有描边线条的艺术家。类似地,描边线可以具有线样式。请参见线型示例:
https://matplotlib.org/stable/gallery/lines_bars_and_markers/linestyles.html。
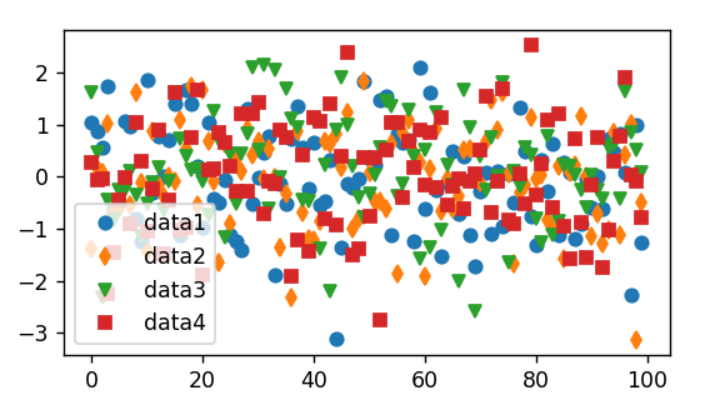
标记大小取决于使用的方法。plot(绘图)以点为单位指定标记大小,通常是标记的“直径”或宽度。scatter(散点)指定标记大小与标记的可视区域大致成比例。有一系列标记样式可用作字符串代码(参见markers),或者用户可以定义自己的标记样式MakerStyle(参见标记参考Marker reference):
·
·
·
·
·
·
·
·
·
·
·
import matplotlib.pyplot as pltimport numpy as npnp.random.seed(19680801) # seed the random number generator.data1, data2, data3, data4 = np.random.randn(4, 100) # make 4 random data setsfig, ax = plt.subplots(figsize=(5, 2.7))ax.plot(data1, 'o', label='data1')ax.plot(data2, 'd', label='data2')ax.plot(data3, 'v', label='data3')ax.plot(data4, 's', label='data4')ax.legend();fig.show()

标签绘图
Axes标签和文本
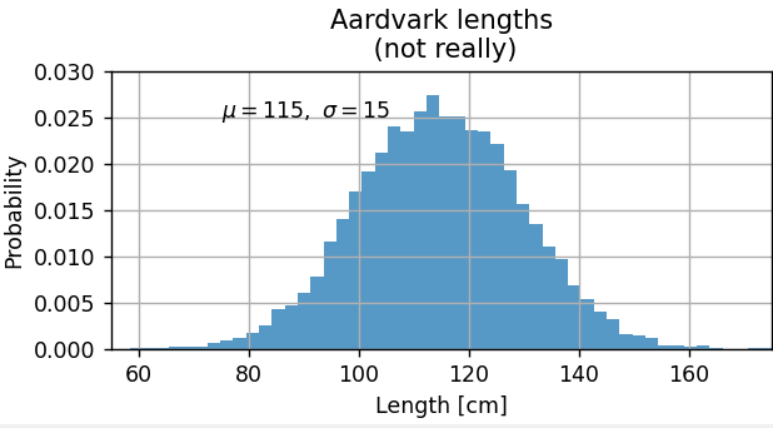
set_xlabel、set_ylabel和set_title用于在指定位置添加文本(有关详细讨论,请参见Matplotlib绘图中的文本)。也可以使用text将文本直接添加到绘图中:
·
·
·
·
·
·
·
·
·
·
·
·
·
·
·
import matplotlib.pyplot as pltimport numpy as npnp.random.seed(19680801) # seed the random number generator.mu, sigma = 115, 15x = mu + sigma * np.random.randn(10000)fig, ax = plt.subplots(figsize=(5, 2.7), layout='constrained')# the histogram of the datan, bins, patches = ax.hist(x, 50, density=True, facecolor='C0', alpha=0.75)ax.set_xlabel('Length [cm]')ax.set_ylabel('Probability')ax.set_title('Aardvark lengths\n (not really)')ax.text(75, .025, r'$\mu=115,\ \sigma=15$')ax.axis([55, 175, 0, 0.03])ax.grid(True);fig.show()

所有文本函数都返回matplotlib.text.text实例。与上面的线一样,可以通过向文本函数传递关键字参数来自定义文本属性:
·
t = ax.set_xlabel('my data', fontsize=14, color='red')
文本属性与布局中详细介绍了这些属性:https://matplotlib.org/stable/tutorials/text/text_props.html。
在文本中使用数学表达式
在Matplotlib任何文本表达式中接受插入TeX等价表达式。例如,在标题中编写表达式σi = 15,可以写一个由美元符号包围的TeX表达式:
·
ax.set_title(r'$\sigma_i=15$')
其中,标题字符串前面的r表示该字符串是一个原始字符串,而不是将反斜杠视为python转义。Matplotlib具有内置的TeX表达式解析器和布局引擎,并提供自己的数学字体–有关详细信息,请参阅编写数学表达式:https://matplotlib.org/stable/tutorials/text/mathtext.html。 还可以直接使用LaTeX格式化文本,并将输出直接合并到显示的图形或保存的脚本中——请参阅使用LaTeX进行文本渲染:
https://matplotlib.org/stable/tutorials/text/usetex.html。
注释
还可以注释绘图上的点,通常通过将指向xy(坐标元组参数)的箭头连接到xytext(坐标元组参数)处的一段文本:
·
·
·
·
·
·
·
·
·
·
import matplotlib.pyplot as pltimport numpy as npfig, ax = plt.subplots(figsize=(5, 2.7))t = np.arange(0.0, 5.0, 0.01)s = np.cos(2 * np.pi * t)line, = ax.plot(t, s, lw=2)ax.annotate('local max', xy=(2, 1), xytext=(3, 1.5), arrowprops=dict(facecolor='black', shrink=0.05))ax.set_ylim(-2, 2);fig.show()

在这个基本示例中,xy和xytext都在数据坐标系中。有多种其他坐标系可供选择--有关详细信息,请参见基本注释:https://matplotlib.org/stable/tutorials/text/annotations.html#annotations-tutorial和高级注释:https://matplotlib.org/stable/tutorials/text/annotations.html#plotting-guide-annotation。更多示例也可以在注释绘图中找到:
https://matplotlib.org/stable/gallery/text_labels_and_annotations/annotation_demo.html。
图例
通常,使用Axes.legend来标识线条或标记:
·
·
·
·
·
·
·
·
·
·
import matplotlib.pyplot as pltimport numpy as npnp.random.seed(19680801) # seed the random number generator.data1, data2, data3 = np.random.randn(3, 100) # make 3 random data setsfig, ax = plt.subplots(figsize=(5, 2.7))ax.plot(np.arange(len(data1)), data1, label='data1')ax.plot(np.arange(len(data2)), data2, label='data2')ax.plot(np.arange(len(data3)), data3, 'd', label='data3')ax.legend();fig.show()

Matplotlib中的图例在布局、位置以及它们所代表的艺术家方面都非常灵活。在图例指南中详细讨论它们:
https://matplotlib.org/stable/tutorials/intermediate/legend_guide.html。