图表域(Axes)容器
图表域(matplotlib.axes.Axes)是matplotlib世界的中心——它包含了图表(Figure)中使用的所有艺术家(Artist)的绝大多数,有很多助手方法来创建这些艺术家,并将其添加到自身中,也有助手方法用来访问和定制其包含的艺术家。与图表(Figure)一样,它也包含一个面片(Patch),这个面片在直角坐标系中为矩形(Rectangle),在极坐标系中为圆形(Circle);此面片确定绘图区域的形状、背景和边界:
matplotlib.axes.Axes:https://matplotlib.org/stable/api/axes_api.html#matplotlib.axes.AxesFigure:https://matplotlib.org/stable/api/figure_api.html#matplotlib.figure.FigurePatch:https://matplotlib.org/stable/api/_as_gen/matplotlib.patches.Patch.html#matplotlib.patches.PatchRectangle:https://matplotlib.org/stable/api/_as_gen/matplotlib.patches.Rectangle.html#matplotlib.patches.RectangleCircle:
https://matplotlib.org/stable/api/_as_gen/matplotlib.patches.Circle.html#matplotlib.patches.Circle
·
·
·
ax = fig.add_subplot()rect = ax.patch # a Rectangle instancerect.set_facecolor('green')
完整代码:
·
·
·
·
·
·
·
·
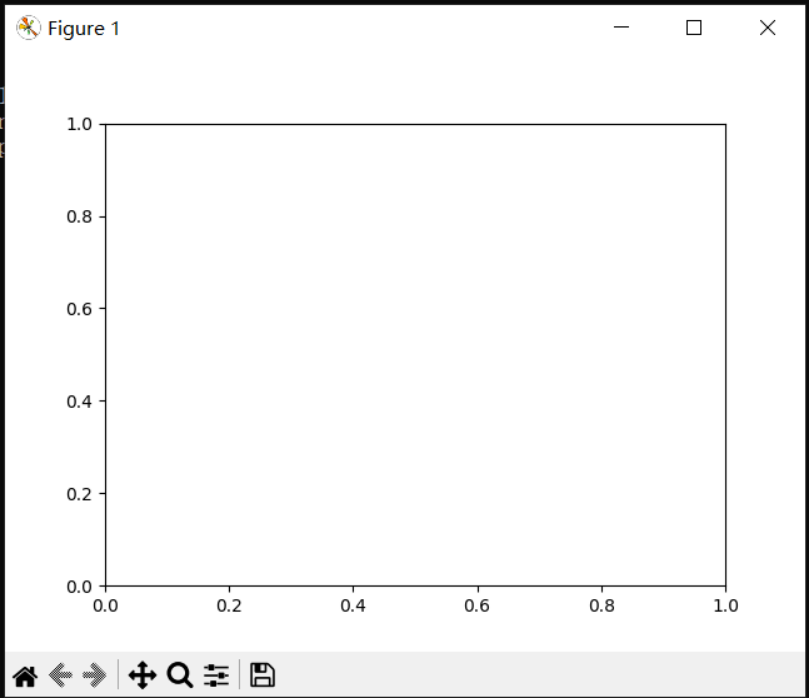
ipython%matplotlib tkimport matplotlib.pyplot as pltfig = plt.figure()ax = fig.add_subplot()rect = ax.patch # a Rectangle instancerect.set_facecolor('green') #把矩形面片变为绿色fig.show()
变绿前后变化:


当调用绘图方法(例如,规范绘图(plot)并传入数组或值列表)时,该方法将创建线(matplotlib.lines.Line2D)实例,使用关键字参数传递的所有Line2D属性更新该线,并将该线添加到图表域(Axes),亦作为函数返回值:plot:https://matplotlib.org/stable/api/_as_gen/matplotlib.axes.Axes.plot.html#matplotlib.axes.Axes.plotmatplotlib.lines.Line2D:
https://matplotlib.org/stable/api/_as_gen/matplotlib.lines.Line2D.html#matplotlib.lines.Line2D
·
·
·
x, y = np.random.rand(2, 100)
line, = ax.plot(x, y, '-', color='blue', linewidth=2)
完整代码:
·
·
·
·
·
·
·
·
·
·
·
ipython%matplotlib tkimport matplotlib.pyplot as pltfig = plt.figure()ax = fig.add_subplot()rect = ax.patch # a Rectangle instancerect.set_facecolor('green') #把矩形面片变为绿色import numpy as npnp.random.seed(19680801) # seed the random number generator.x, y = np.random.rand(2, 100)line, = ax.plot(x, y, '-', color='blue', linewidth=2)

因为可以传入plot多个x,y对进行绘制,所以返回一个线(Line2D)的列表。上面的代码只是将长度为1的列表解包第一个元素到line变量中。该线已添加到Axes.lines列表中:
·
·
In [2]: print(ax.lines)<Axes.ArtistList of 1 lines>
类似地,创建面片的方法,如bar()创建矩形列表,将面片添加到Axes.patches列表中:bar():
https://matplotlib.org/stable/api/_as_gen/matplotlib.axes.Axes.bar.html#matplotlib.axes.Axes.bar
·
·
·
·
·
·
·
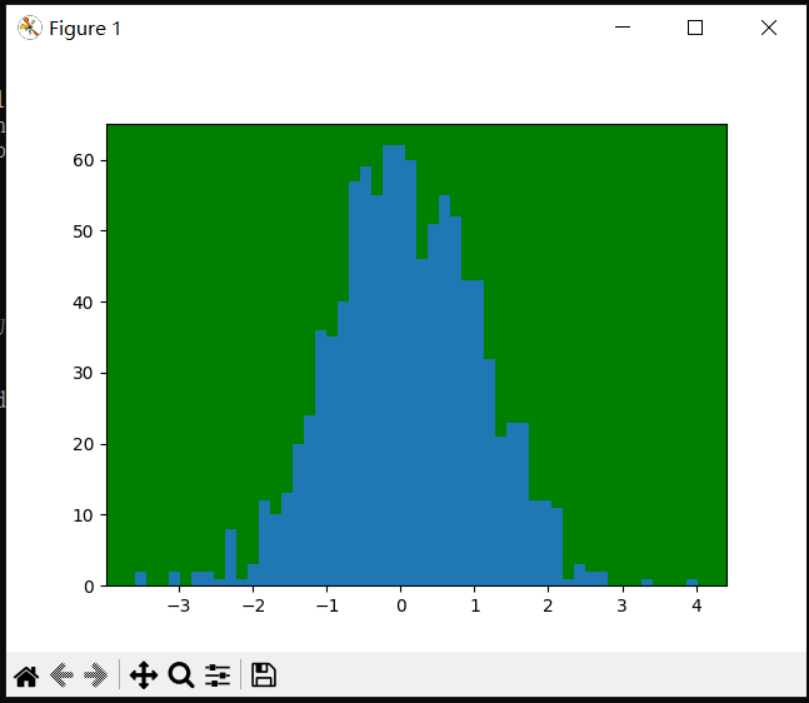
In [3]: n, bins, rectangles = ax.hist(np.random.randn(1000), 50)
In [4]: rectanglesOut[4]: <BarContainer object of 50 artists>
In [5]: print(len(ax.patches))50
完整代码:
·
·
·
·
·
·
·
·
·
·
·
·
·
·
ipython%matplotlib tkimport matplotlib.pyplot as pltfig = plt.figure()ax = fig.add_subplot()rect = ax.patch # a Rectangle instancerect.set_facecolor('green') #把矩形面片变为绿色import numpy as npnp.random.seed(19680801) # seed the random number generator.n, bins, rectangles = ax.hist(np.random.randn(1000), 50)rectangles<BarContainer object of 50 artists>print(len(ax.patches))50

不可以将对象直接添加到Axes.lines或Axes.patches列表中,因为Axes在创建和添加对象时需要做以下一些事情:
● 设置艺术家(Artist)的图表(figure)和图表域(axes)属性;
● 设置默认的图表域(Axes)变换(除非已经设置了变换);
● 检查Artist中包含的数据,以更新控制自动缩放的数据结构,从而可以调整视图限制以容纳绘制的数据。
不过,用户可以使用add_line和add_patch等助手方法自己直接创建对象,并将它们添加到Axes中。下面是一个带注释的交互式会话,说明了正在发生的事情:add_line:https://matplotlib.org/stable/api/_as_gen/matplotlib.axes.Axes.add_line.html#matplotlib.axes.Axes.add_lineadd_patch:
https://matplotlib.org/stable/api/_as_gen/matplotlib.axes.Axes.add_patch.html#matplotlib.axes.Axes.add_patch
·
·
·
·
·
·
·
C:\Users\5xstar>ipythonPython 3.11.0 (main, Oct 24 2022, 18:26:48) [MSC v.1933 64 bit (AMD64)]Type 'copyright', 'credits' or 'license' for more informationIPython 8.7.0 -- An enhanced Interactive Python. Type '?' for help.In [1]: %matplotlib tk ...: import matplotlib.pyplot as pltIn [2]: fig, ax = plt.subplots()

·
·
·
·
·
·
·
·
·
·
·
·
·
·
·
·
·
·
·
·
·
·
·
·
·
·
·
·
·
·
·
·
·
·
·
·
·
·
·
·
·
·
·
·
·
·
·
·
·
·
·
·
·
·
·
·
·
·
·
·
·
·
·
·
·
·
·
·
·
·
·
·
·
·
·
·
#创建一个矩形对象In [4]: import matplotlib as mplIn [5]: rect = mpl.patches.Rectangle((1, 1), width=5, height=12)
#这个矩形对象的axes参数默认为空In [6]: print(rect.axes)None
#并且转换实例被设置为“身份转换”In [7]: print(rect.get_data_transform())IdentityTransform()
#现在把这个矩形(Rectangle)添加到这个图表域(Axes)中In [8]: ax.add_patch(rect)Out[8]: <matplotlib.patches.Rectangle at 0x200c5b17010>
#注意ax.add_patch方法已经设置了axes属性为该Axes对象In [9]: print(rect.axes)AxesSubplot(0.125,0.11;0.775x0.77)
#并且转换器也已设置In [10]: print(rect.get_data_transform())CompositeGenericTransform( TransformWrapper( BlendedAffine2D( IdentityTransform(), IdentityTransform())), CompositeGenericTransform( BboxTransformFrom( TransformedBbox( Bbox(x0=0.0, y0=0.0, x1=1.0, y1=1.0), TransformWrapper( BlendedAffine2D( IdentityTransform(), IdentityTransform())))), BboxTransformTo( TransformedBbox( Bbox(x0=0.125, y0=0.10999999999999999, x1=0.9, y1=0.88), BboxTransformTo( TransformedBbox( Bbox(x0=0.0, y0=0.0, x1=6.4, y1=4.8), Affine2D().scale(100.0))))))) #默认axes转换器为ax.transData In [11]: print(ax.transData)CompositeGenericTransform( TransformWrapper( BlendedAffine2D( IdentityTransform(), IdentityTransform())), CompositeGenericTransform( BboxTransformFrom( TransformedBbox( Bbox(x0=0.0, y0=0.0, x1=1.0, y1=1.0), TransformWrapper( BlendedAffine2D( IdentityTransform(), IdentityTransform())))), BboxTransformTo( TransformedBbox( Bbox(x0=0.125, y0=0.10999999999999999, x1=0.9, y1=0.88), BboxTransformTo( TransformedBbox( Bbox(x0=0.0, y0=0.0, x1=6.4, y1=4.8), Affine2D().scale(100.0))))))) #注意,Axes的xlimits没有更改In [12]: print(ax.get_xlim())(0.0, 1.0)
#但数据限制已更新为包含矩形In [13]: print(ax.dataLim.bounds)(1.0, 1.0, 5.0, 12.0)
#我们可以手动调用自动缩放机制In [14]: ax.autoscale_view()

·
·
·
·
·
·
#现在xlim被更新为包含矩形,加上边距In [15]: print(ax.get_xlim())(0.75, 6.25)
#如果没有设置%matplotlib tk (tk只是一个界面名称),还要手动绘制图形In [16]: fig.canvas.draw()
图表域(Axes)有很多很多助手方法用于创建基本体艺术家(primitive Artists),并将其添加到各自对应的收集器(container)中。下表总结了它们中的小部分,标出创建的艺术家(Artist)类型以及他们的存放地方:
Axes helper method 图表域助手方法 | Artist 艺术家 | Container 收集器 |
annotate - text annotations -文本注释 | Annotation | ax.texts |
bar - bar charts -条形图 | Rectangle | ax.patches |
errorbar - error bar plots -误差条形图 | Line2D Rectangle | ax.lines ax.patches |
fill - shared area -共有面积 | Polygon | ax.patches |
hist - histograms -直方图 | Rectangle | ax.patches |
imshow - image data -图像数据 | AxesImage | ax.images |
legend - Axes legend -图例 | Legend | ax.get_legend() |
plot - xy plots -xy关系绘图 | Line2D | ax.lines |
scatter - scatter charts -散点图 | PolyCollection | ax.collections |
text - text -文本 | Text | ax.texts |
·
·
·
·
·
·
·
·
·
·
·
·
·
·
·
·
·
·
·
·
·
·
·
·
·
·
·
·
·
·
·
·
·
·
·
·
·
·
·
·
·
·
·
·
上表逐项列举与链接Axes helper method/Artist/Container
annotate - text annotations:https://matplotlib.org/stable/api/_as_gen/matplotlib.axes.Axes.annotate.html#matplotlib.axes.Axes.annotateAnnotation:https://matplotlib.org/stable/api/text_api.html#matplotlib.text.Annotationax.texts
bar - bar charts:https://matplotlib.org/stable/api/_as_gen/matplotlib.axes.Axes.bar.html#matplotlib.axes.Axes.barRectangle:https://matplotlib.org/stable/api/_as_gen/matplotlib.patches.Rectangle.html#matplotlib.patches.Rectangleax.patches
errorbar - error bar plots:https://matplotlib.org/stable/api/_as_gen/matplotlib.axes.Axes.errorbar.html#matplotlib.axes.Axes.errorbarLine2D:https://matplotlib.org/stable/api/_as_gen/matplotlib.lines.Line2D.html#matplotlib.lines.Line2Dax.linesRectangle:https://matplotlib.org/stable/api/_as_gen/matplotlib.patches.Rectangle.html#matplotlib.patches.Rectangleax.patches
fill - shared area:https://matplotlib.org/stable/api/_as_gen/matplotlib.axes.Axes.fill.html#matplotlib.axes.Axes.fillPolygon:https://matplotlib.org/stable/api/_as_gen/matplotlib.patches.Polygon.html#matplotlib.patches.Polygonax.patches
hist - histograms:https://matplotlib.org/stable/api/_as_gen/matplotlib.axes.Axes.hist.html#matplotlib.axes.Axes.histRectangle:https://matplotlib.org/stable/api/_as_gen/matplotlib.patches.Rectangle.html#matplotlib.patches.Rectangleax.patches
imshow - image data:https://matplotlib.org/stable/api/_as_gen/matplotlib.axes.Axes.imshow.html#matplotlib.axes.Axes.imshowAxesImage:https://matplotlib.org/stable/api/image_api.html#matplotlib.image.AxesImageax.images
legend - Axes legend:https://matplotlib.org/stable/api/_as_gen/matplotlib.axes.Axes.legend.html#matplotlib.axes.Axes.legendLegend:https://matplotlib.org/stable/api/legend_api.html#matplotlib.legend.Legendax.get_legend()
plot - xy plots:https://matplotlib.org/stable/api/_as_gen/matplotlib.axes.Axes.plot.html#matplotlib.axes.Axes.plotLine2D:https://matplotlib.org/stable/api/_as_gen/matplotlib.lines.Line2D.html#matplotlib.lines.Line2Dax.lines
scatter - scatter charts:https://matplotlib.org/stable/api/_as_gen/matplotlib.axes.Axes.scatter.html#matplotlib.axes.Axes.scatterPolyCollection:https://matplotlib.org/stable/api/collections_api.html#matplotlib.collections.PolyCollectionax.collections
text - text:https://matplotlib.org/stable/api/_as_gen/matplotlib.axes.Axes.text.html#matplotlib.axes.Axes.textText:https://matplotlib.org/stable/api/text_api.html#matplotlib.text.Textax.texts
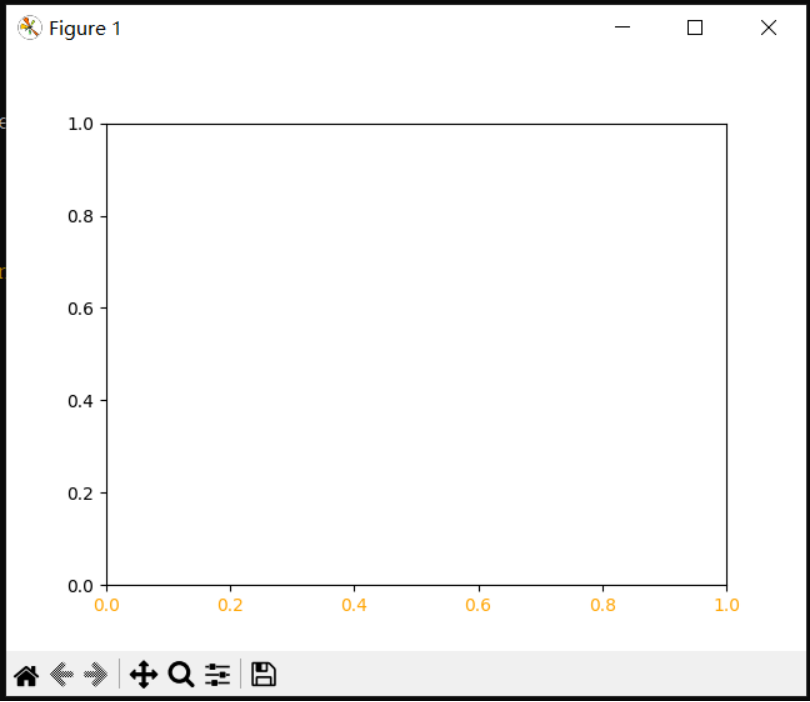
除了所有这些Artists之外,Axes还包含两个重要的Artist容器:X轴(XAxis)和Y轴(YAxis),用于处理刻度和标签的绘制。它们作为实例变量存储在xaxis和yaxis属性中。下面将详细介绍XAxis和YAxis容器,但请注意,Axes也包含很多助手方法,间接调用Axis实例方法。除非用户不介意使用这些间接方法,否则通常不需要直接使用它们。例如,用户可以使用Axes助手方法设置XAxis刻度标签的字体颜色:XAxis:https://matplotlib.org/stable/api/axis_api.html#matplotlib.axis.XAxisYAxis:https://matplotlib.org/stable/api/axis_api.html#matplotlib.axis.YAxis
Axis:
https://matplotlib.org/stable/api/axis_api.html#matplotlib.axis.Axis
·
ax.tick_params(axis='x', labelcolor='orange')
完整代码:
·
·
·
·
·
ipython%matplotlib tkimport matplotlib.pyplot as pltfig, ax = plt.subplots()ax.tick_params(axis='x', labelcolor='orange')

以下是Axes包含的艺术家摘要:
Axes attribute Axes属性 | Description 描述 |
artists | An ArtistList of Artist instances 艺术家对象的艺术家列表 |
patch | Rectangle instance for Axes background 图表域的背景矩形对象 |
collections | An ArtistList of Collection instances 集合对象的艺术家列表 |
images | An ArtistList of AxesImage 图表域图像的艺术家列表 |
lines | An ArtistList of Line2D instances 平面线的艺术家列表 |
patches | An ArtistList of Patch instances 面片对象的艺术家列表 |
texts | An ArtistList of Text instances 文本对象的艺术家列表 |
xaxis | A matplotlib.axis.XAxis instance X轴对象 |
yaxis | A matplotlib.axis.YAxis instance Y轴对象 |
图例可以通过get_legend方法获取。ArtistList:https://matplotlib.org/stable/api/axes_api.html#matplotlib.axes.Axes.ArtistListArtist:https://matplotlib.org/stable/api/artist_api.html#matplotlib.artist.ArtistCollection:https://matplotlib.org/stable/api/collections_api.html#matplotlib.collections.Collectionget_legend:
https://matplotlib.org/stable/api/_as_gen/matplotlib.axes.Axes.get_legend.html#matplotlib.axes.Axes.get_legend