matplotlib.pyplot.legend
matplotlib.pyplot.legend(*args, **kwargs)
[原码]
https://github.com/matplotlib/matplotlib/blob/v3.6.3/lib/matplotlib/pyplot.py#L2644-L2646
在图表域(Axes)上放置图例。
调用签名:
·
·
·
·
legend()legend(handles, labels)legend(handles=handles)legend(labels)
以下是调用签名对应于使用此方法的不同方式:
1.自动检测图例中要显示的元素
当不传递任何额外参数时,将自动确定要添加到图例中的元素。
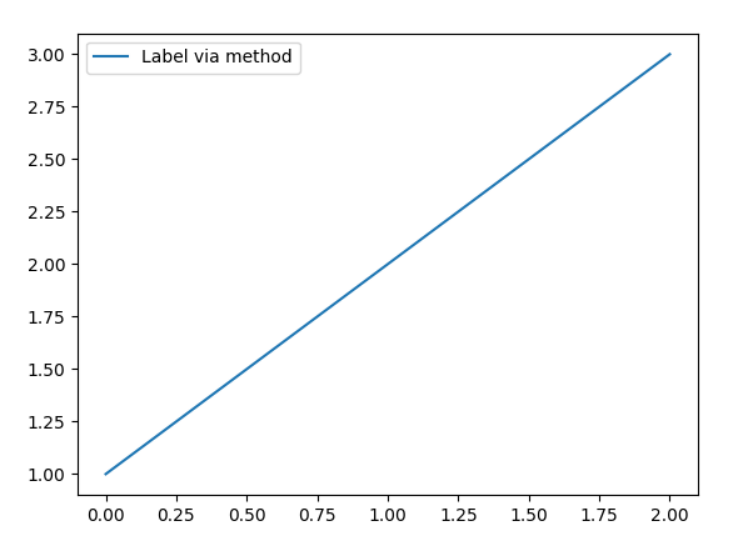
在这种情况下,标签取自有关的艺术家。可以在艺术家创建时或通过调用艺术家的set_label()方法来指定它们:
·
·
ax.plot([1, 2, 3], label='Inline label')ax.legend()
完整代码:
·
·
·
·
·
·
·
ipython%matplotlib tkimport matplotlib.pyplot as pltfig = plt.figure()ax = fig.add_subplot()ax.plot([1, 2, 3], label='Inline label')ax.legend()

或者
·
·
·
line, = ax.plot([1, 2, 3])line.set_label('Label via method')ax.legend()
完整代码:
·
·
·
·
·
·
·
·
ipython%matplotlib tkimport matplotlib.pyplot as pltfig = plt.figure()ax = fig.add_subplot()line, = ax.plot([1, 2, 3])line.set_label('Label via method')ax.legend()
注意:
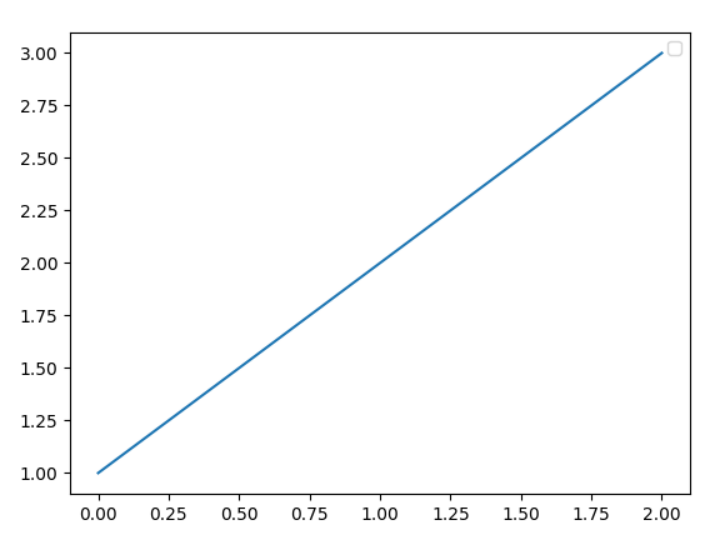
通过使用以下划线“_”开头的字符串作为艺术家的标签,可以从自动图例元素选择中排除该艺术家。以下划线开头的字符串是所有艺术家的默认标签,因此在没有任何参数且没有手动设置标签的情况下调用Axes.legend将不会绘制图例。
完整代码:
·
·
·
·
·
·
·
ipython%matplotlib tkimport matplotlib.pyplot as pltfig = plt.figure()ax = fig.add_subplot()line, = ax.plot([1, 2, 3], label='_No legend')ax.legend()
或
·
·
·
·
·
·
·
·
ipython%matplotlib tkimport matplotlib.pyplot as pltfig = plt.figure()ax = fig.add_subplot()line, = ax.plot([1, 2, 3])ax.legend()
set_label():
https://matplotlib.org/stable/api/_as_gen/matplotlib.artist.Artist.set_label.html#matplotlib.artist.Artist.set_label
2.明确列出图例中的艺术家和标签
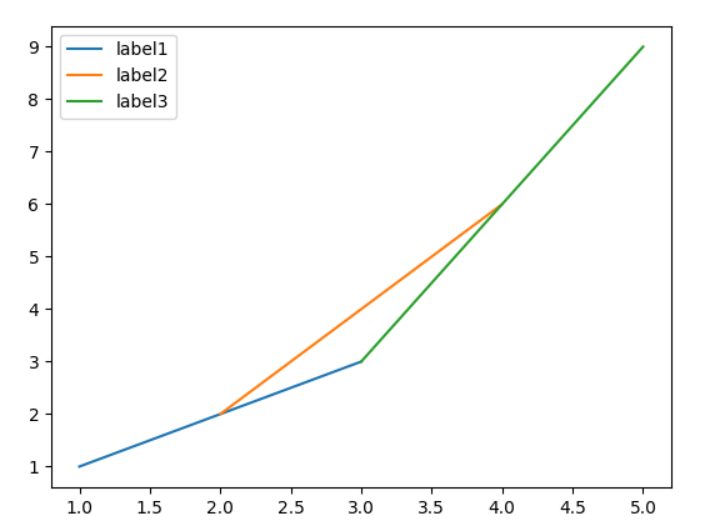
为了完全控制哪些艺术家有一个图例条目,可以分别传递一个图例艺术家的可迭代对象和一个图例标签的可迭代对象:
·
ax.legend([line1, line2, line3], ['label1', 'label2', 'label3'])
完整代码:
·
·
·
·
·
·
·
·
·
ipython%matplotlib tkimport matplotlib.pyplot as pltfig = plt.figure()ax = fig.add_subplot()lines = ax.plot([1, 2, 3], [1, 2, 3], [2, 3, 4], [2, 4, 6], [3, 4, 5], [3, 6, 9])ax.legend(lines, ['label1', 'label2', 'label3'])
3.明确列出图例中的艺术家
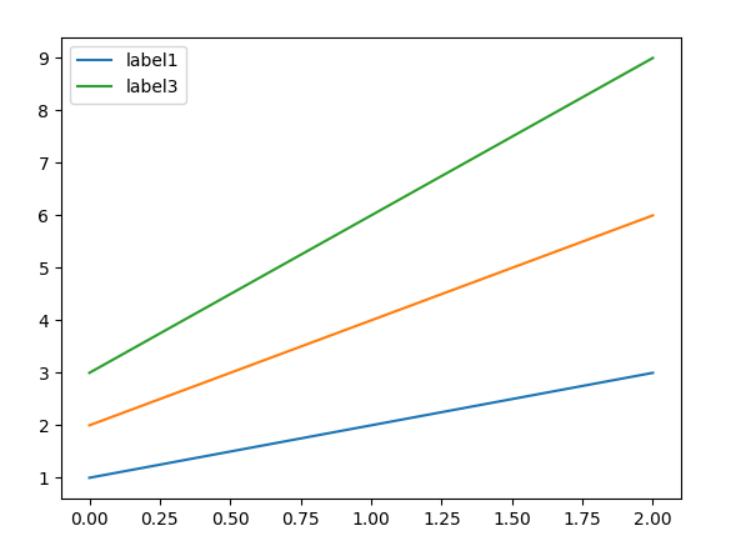
这类似于2,但标签取自艺术家的标签属性。例子:
·
·
·
·
line1, = ax.plot([1, 2, 3], label='label1')line2, = ax.plot([2, 4, 6], label='label2')line3, = ax.plot([3, 6, 9], label='label3')ax.legend(handles=[line1, line3])
完整代码:
·
·
·
·
·
·
·
·
·
ipython%matplotlib tkimport matplotlib.pyplot as pltfig = plt.figure()ax = fig.add_subplot()line1, = ax.plot([1, 2, 3], label='label1')line2, = ax.plot([2, 4, 6], label='label2')line3, = ax.plot([3, 6, 9], label='label3')ax.legend(handles=[line1, line3])
4.标记现有绘图元素
不鼓励的:
这种调用签名是不鼓励的,因为绘图元素和标签之间的关系仅由它们的顺序隐含,并且很容易混淆。
要为Axes上的所有艺术家制作图例,请使用字符串可迭代对象调用此函数,每个图例项对应一个字符串。例如:
·
·
·
ax.plot([1, 2, 3])ax.plot([5, 6, 7])ax.legend(['First line', 'Second line'])
完整代码:
·
·
·
·
·
·
·
·
ipython%matplotlib tkimport matplotlib.pyplot as pltfig = plt.figure()ax = fig.add_subplot()ax.plot([1, 2, 3])ax.plot([5, 6, 7])ax.legend(['First line', 'Second line'])

参数(Parameters):
handles:艺术家(Artist)序列,可选
句柄序列。要添加到图例中的艺术家(线条、面片)序列。如果需要对图例中显示的内容进行完全控制,并且上述自动机制不够,请将其与标签参数(下面)一起使用。
在与标签参数一起使用的情况下,两个参数的长度应该相同,否则将被截断为较小的长度。
Artist:
https://matplotlib.org/stable/api/artist_api.html#matplotlib.artist.Artist
labels:字符串(str)列表, 可选
显式标签字符串列表。要在艺术家旁边显示的标签列表。如果需要对图例中显示的内容进行完全控制,并且上述自动机制不够,请将其与handles参数一起使用。
返回(Returns):
Legend对象:
https://matplotlib.org/stable/api/legend_api.html#matplotlib.legend.Legend
其他参数(Other Parameters):
loc:字符串或一对浮点数,默认值:rcParams["Legend.loc"](默认:'best')('best'用于图表域(axes),'upper right'用于图表(figure))
图例的放置位置。
字符串“upper left(上左)”、“upper right(上右)”、“lower left(下左)”和“lower right(下右)”将图例放置在图表域(axes)/图表(figure)的相应角落。
字符串“upper center(上中心)”、“lower center(下中心)”、“center left(左中心)”、“center right(右中心)”将图例放置在图表域(axes)/图表(figure)的相应边缘的中心。
字符串“center(中心)”将图例放置在图表域(axes)/图表(figure)的中心。
字符串“best(最好的)”将图例放置在上面定义的九个位置中的某个位置(注:只适用于图表域(Axes)),与其他绘制的艺术家的重叠最小。对于具有大量数据的绘图,此选项可能非常慢;提供一个特定的位置可能有助于提高绘图速度。
位置也可以是2元组,以图表域(axes)坐标表示图例左下角的坐标(在这种情况下,将忽略bbox_to_anchor)。
为了向后兼容,“center right(右中心)”(其他位置不行)也可以拼写为“right”,每个“string(字符串)”位置也可以用数字值表示:
Location String 字符串位置 | Location Code 数字值 |
'best' | 0 |
'upper right' | 1 |
'upper left' | 2 |
'lower left' | 3 |
'lower right' | 4 |
'right' | 5 |
'center left' | 6 |
'center right' | 7 |
'lower center' | 8 |
'upper center' | 9 |
'center' | 10 |
测试完整代码:
·
·
·
·
·
·
·
·
ipython%matplotlib tkimport matplotlib.pyplot as pltfig = plt.figure()ax = fig.add_subplot()ax.plot([1, 2, 3])ax.plot([5, 6, 7])ax.legend(['First line', 'Second line'], loc='center')
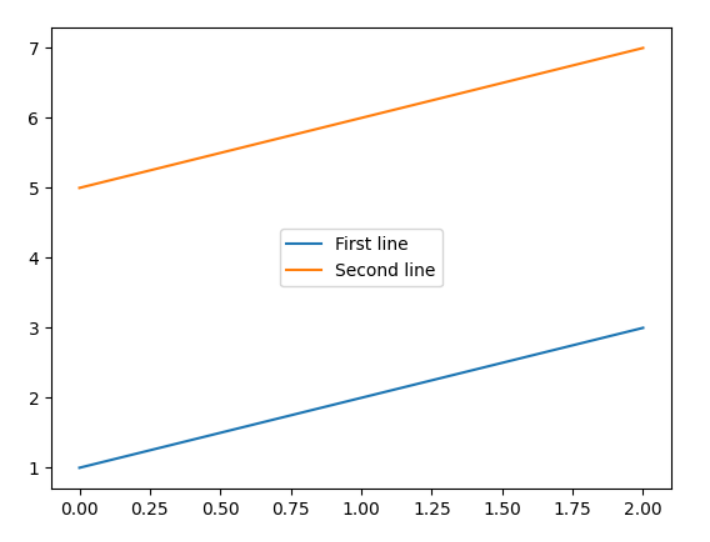
测试完整代码:
·
·
·
·
·
·
·
·
ipython%matplotlib tkimport matplotlib.pyplot as pltfig = plt.figure()ax = fig.add_subplot()ax.plot([1, 2, 3])ax.plot([5, 6, 7])ax.legend(['First line', 'Second line'], loc='best')

rcParams["Legend.loc"]:
https://matplotlib.org/stable/tutorials/introductory/customizing.html?highlight=legend.loc#matplotlibrc-sample
bbox_to_anchor:BboxBase实例、浮点数2元组或4元组
用于与loc一起定位图例的框。默认为axes.bbox(如果作为Axes.legend的方法调用)或figure.bbox(如果是Figure.legend)。此参数允许任意放置图例。
Bbox坐标在bbox_transform参数给定的坐标系中进行解释。如果没有指定坐标系,则默认坐标由调用legend者而定,Axes调用是Axes坐标系,Figure调用是Figure坐标系。
如果给定了一个4元组或BboxBase,则它指定放置图例的bbox(x,y,width,height)。要将图例放置在axes(图表域)右下象限的最佳位置,请执行以下操作:注:figure(图表)不支持loc='best'。
·
loc='best', bbox_to_anchor=(0.5, 0., 0.5, 0.5)
测试完整代码:
·
·
·
·
·
·
·
·
ipython%matplotlib tkimport matplotlib.pyplot as pltfig = plt.figure()ax = fig.add_subplot()ax.plot([1, 2, 3])ax.plot([5, 6, 7])ax.legend(['First line', 'Second line'], loc='best', bbox_to_anchor=(0.5, 0., 0.5, 0.5)
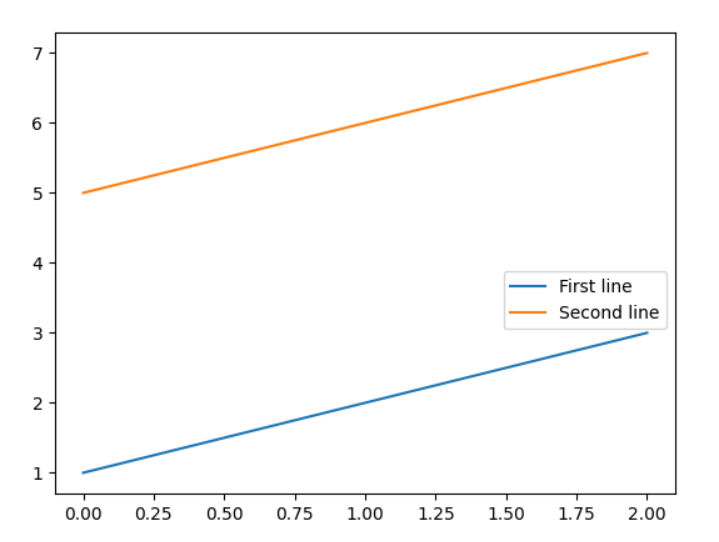
2元组(x, y)将loc指定的图例的角放在(x, y)处。例如,要将图例的右上角放在axes(图表域)/figure(图表)的中心,可以使用以下关键字:
·
loc='upper right', bbox_to_anchor=(0.5, 0.5)
测试完整代码:
·
·
·
·
·
·
·
·
·
·
ipython%matplotlib tkimport matplotlib.pyplot as pltfig=plt.figure()ax = plt.subplot(211)ax.plot([1, 2, 3])ax.plot([5, 6, 7])ax.legend(['First line', 'Second line'], loc='upper right', bbox_to_anchor=( 0.5, 0.5))
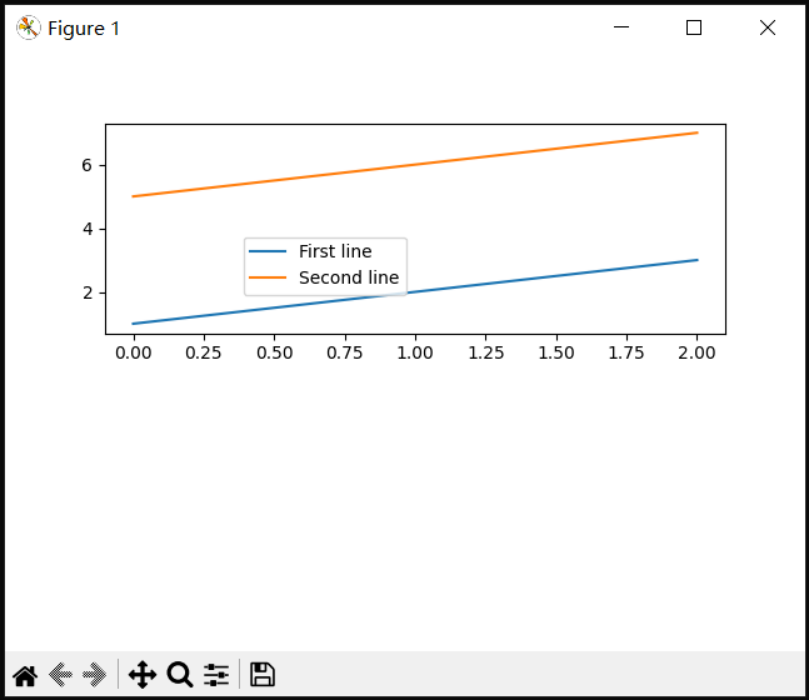
测试完整代码:
·
·
·
·
·
·
·
·
·
·
ipython%matplotlib tkimport matplotlib.pyplot as pltfig=plt.figure()ax = plt.subplot(211)ax.plot([1, 2, 3])ax.plot([5, 6, 7])fig.legend(['First line', 'Second line'], loc='upper right', bbox_to_anchor=( 0.5, 0.5))

BboxBase:https://matplotlib.org/stable/api/transformations.html#matplotlib.transforms.BboxBaseAxes.legend:https://matplotlib.org/stable/api/_as_gen/matplotlib.axes.Axes.legend.html#matplotlib.axes.Axes.legendFigure.legend:
https://matplotlib.org/stable/api/figure_api.html#matplotlib.figure.Figure.legend
ncols:整数(int),默认值:1
图例的列数。
为了向后兼容,拼写ncol也受支持,但不鼓励使用。如果两者都给出,则ncols优先。
prop:None或matplotlib.font_manager.FontProperties或dict
图例的字体属性。如果无(默认值),则将使用当前matplotlib.rcParams。
FontProperties:https://matplotlib.org/stable/api/font_manager_api.html#matplotlib.font_manager.FontPropertiesmatplotlib.rcParams:
https://matplotlib.org/stable/api/matplotlib_configuration_api.html#matplotlib.rcParams
fontsize:int 或 {'xx-small', 'x-small', 'small', 'medium', 'large', 'x-large', 'xx-large'}
图例的字体大小。如果该值是数字,则大小将是以点为单位的绝对字体大小。字符串值与当前默认字体大小相关。仅当未指定prop时才使用此参数。
labelcolor:str 或 list,默认:rcParams["legend.labelcolor"] (该值默认:'None')
图例中文本的颜色。有效的颜色字符串(例如'red')或颜色字符串列表。也可以使用'linecolor'、'markerfacecolor'(或'mfc')或'markeredgecolor'(或'mec')使标签颜色与线条或标记的颜色相匹配。
可以使用rcParams["legend.Labelcolor"](默认值:'None')全局设置Labelcolor。如果无此设置,则使用rcParams["text.color"](默认值:'black')。
rcParams["legend.labelcolor"]:https://matplotlib.org/stable/tutorials/introductory/customizing.html?highlight=legend.labelcolor#matplotlibrc-samplercParams["text.color"]:
https://matplotlib.org/stable/tutorials/introductory/customizing.html?highlight=text.color#matplotlibrc-sample
numpoints:int,默认值:rcParams["legend.numpoints"] (默认:1)
为Line2D(线)创建图例条目时图例中标记点的数量。
rcParams["legend.numpoints"]:
https://matplotlib.org/stable/tutorials/introductory/customizing.html?highlight=legend.numpoints#matplotlibrc-sample
scatterpoints:int,默认值:rcParams["legend.scatterpoints"] (默认值:1)
为PathCollection(散点图)创建图例条目时图例中标记点的数量。
rcParams["legend.scatterpoints"]:https://matplotlib.org/stable/tutorials/introductory/customizing.html?highlight=legend.scatterpoints#matplotlibrc-samplePathCollection:
https://matplotlib.org/stable/api/collections_api.html#matplotlib.collections.PathCollection
scatteryoffsets:浮点数可迭代对象,默认值: [0.375, 0.5, 0.3125]
为散点图图例条目创建的标记的垂直偏移(相对于字体大小)。0.0位于图例文本的底部,1.0位于顶部。要在相同的高度绘制所有标记,请设置为[0.5]。
markerscale:float,默认值:rcParams["legend.markerscale"](默认值:1.0)
图例标记与最初绘制的标记相比的相对大小。
rcParams["legend.markerscale"]:
https://matplotlib.org/stable/tutorials/introductory/customizing.html?highlight=legend.markerscale#matplotlibrc-sample
markerfirst:bool,默认值:True
如果为True,图例标记将放置在图例标签的左侧。如果为False,图例标记将放置在图例标签的右侧。
frameon:bool,默认值:rcParams["legend.frameon"](默认值:True)
图例是否应绘制在面片(窗体)上。
rcParams["legend.frameon"]:
https://matplotlib.org/stable/tutorials/introductory/customizing.html?highlight=legend.frameon#matplotlibrc-sample
fancybox:bool,默认值:rcParams["legend.fancybox"] (默认值:True)
花式框。是否应在构成图例背景的FancyBboxPatch(花式框面片)周围启用圆边。
rcParams["legend.fancybox"]:https://matplotlib.org/stable/tutorials/introductory/customizing.html?highlight=legend.fancybox#matplotlibrc-sampleFancyBboxPatch:
https://matplotlib.org/stable/api/_as_gen/matplotlib.patches.FancyBboxPatch.html#matplotlib.patches.FancyBboxPatch
shadow:bool,默认值:rcParams["legend.shadow"] (默认值:False)
是否在图例背后画上阴影。
rcParams["legend.shadow"]:
https://matplotlib.org/stable/tutorials/introductory/customizing.html?highlight=legend.shadow#matplotlibrc-sample
framealpha:float,默认值:rcParams["legend.framealpha"] (默认值:0.8)
图例背景的alpha透明度。如果阴影已激活且framealpha为“None”,则忽略默认值。
rcParams["legend.framealpha"] :
https://matplotlib.org/stable/tutorials/introductory/customizing.html?highlight=legend.framealpha#matplotlibrc-sample
facecolor:"inherit" 或 color,默认值:rcParams["legend.facecolor"](默认值:'inherit')
图例的背景色。如果"inherit"(继承),则使用rcParams["axes.facecolor"] (默认值:'white')。
rcParams["legend.facecolor"]:
https://matplotlib.org/stable/tutorials/introductory/customizing.html?highlight=legend.facecolor#matplotlibrc-samplercParams["axes.facecolor"] :
https://matplotlib.org/stable/tutorials/introductory/customizing.html?highlight=axes.facecolor#matplotlibrc-sample
edgecolor:"inherit" 或 color,默认值:rcParams["legend.edgecolor"](默认值:“0.8”)
图例的背景面片边缘颜色。如果“inherit”,则使用rcParams["axes.edgecolor"](默认值:“black”)。
rcParams["legend.edgecolor"]:https://matplotlib.org/stable/tutorials/introductory/customizing.html?highlight=legend.edgecolor#matplotlibrc-samplercParams["axes.edgecolor"]:
https://matplotlib.org/stable/tutorials/introductory/customizing.html?highlight=axes.edgecolor#matplotlibrc-sample
mode:{"expand", None}
如果mode(模式)设置为"expand"(展开),图例将水平展开以填充axes(图表域)区域(如果定义图例的大小,则为bbox_to_anchor)。
bbox_transform:None 或 matplotlib.transforms.Transform
边界框(bbox_to_anchor)的变换。对于值None(默认值),将使用Axes的transAxes变换。
matplotlib.transforms.Transform:
https://matplotlib.org/stable/api/transformations.html#matplotlib.transforms.Transform
title:str 或 None
图例的标题。默认为无标题(None)。
title_fontproperties:None 或 matplotlib.font_manager.FontProperties 或 dict
图例标题的字体属性。如果None(默认),则将使用title_fontsize参数(如果存在);如果title_fontsize也为None,则将使用当前的rcParams["legend.title_fontsize"] (默认值:None)。
matplotlib.font_manager.FontProperties:https://matplotlib.org/stable/api/font_manager_api.html#matplotlib.font_manager.FontPropertiesrcParams["legend.title_fontsize"] :
https://matplotlib.org/stable/tutorials/introductory/customizing.html?highlight=legend.title_fontsize#matplotlibrc-sample
title_fontsize:int 或 {'xx-small', 'x-small', 'small', 'medium', 'large', 'x-large', 'xx-large'}, 默认值:rcParams["legend.title_fontsize"](默认值: None)
图例标题的字体大小。注意:这不能与title_fontproperties组合使用。如果要与其他字体属性一起设置字体大小,请使用title_fontproperties中的size参数。
rcParams["legend.title_fontsize"]:
https://matplotlib.org/stable/tutorials/introductory/customizing.html?highlight=legend.title_fontsize#matplotlibrc-sample
alignment:{'center', 'left', 'right'},默认值:'center'
图例标题和条目框的对齐方式。条目作为单个块对齐,以使标记始终对齐。
borderpad:float,默认值:rcParams["legend.borderpad"] (默认值:0.4)
图例边框内的分数空白,以字体大小为单位。
rcParams["legend.borderpad"]:
https://matplotlib.org/stable/tutorials/introductory/customizing.html?highlight=legend.borderpad#matplotlibrc-sample
labelspacing:float,默认值:rcParams["legend.labelspacing"] (默认值:0.5)
图例条目之间的垂直间距,以字体大小为单位。
rcParams["legend.labelspacing"] :
https://matplotlib.org/stable/tutorials/introductory/customizing.html?highlight=legend.labelspacing#matplotlibrc-sample
handlelength:float,默认值:rcParams["legend.handlelength"](默认值:2.0)
图例句柄的长度(以字体大小为单位)。
rcParams["legend.handlelength"]:
https://matplotlib.org/stable/tutorials/introductory/customizing.html?highlight=legend.handlelength#matplotlibrc-sample
handleheight:float,默认值:rcParams["legend.handleheight"] (默认值:0.7)
图例句柄的高度(以字体大小为单位)。
rcParams["legend.handleheight"] :
https://matplotlib.org/stable/tutorials/introductory/customizing.html?highlight=legend.handleheight#matplotlibrc-sample
handletextpad:float,默认值:rcParams["legend.handletextpad"](默认值:0.8)
图例句柄和文本之间的空白,以字体大小为单位。
rcParams["legend.handletextpad"]:
https://matplotlib.org/stable/tutorials/introductory/customizing.html?highlight=legend.handletextpad#matplotlibrc-sample
borderaxespad:float,默认值:rcParams["legend.borderaxespad"](默认值:0.5)
图表域(axes)和图例边框之间的空白,以字体大小为单位。
rcParams["legend.borderaxespad"]:
https://matplotlib.org/stable/tutorials/introductory/customizing.html?highlight=legend.borderaxespad#matplotlibrc-sample
columnspacing:float,默认值:rcParams["legend.columnspacing"](默认值:2.0)
列之间的间距,以字体大小为单位。
rcParams["legend.columnspacing"]:
https://matplotlib.org/stable/tutorials/introductory/customizing.html?highlight=legend.columnspacing#matplotlibrc-sample
handler_map:dict 或 None
将实例或类型映射到图例处理者的自定义字典。此handler_map更新matplotlib.legend.Legend.get_legend_handler_map中的默认处理者映射。
matplotlib.legend.Legend.get_legend_handler_map:https://matplotlib.org/stable/api/legend_api.html#matplotlib.legend.Legend.get_legend_handler_map
拓展阅读
Figure.legend:
https://matplotlib.org/stable/api/figure_api.html#matplotlib.figure.Figure.legend
注意
此功能不支持某些艺术家。有关详细信息,请参阅图例指南(Legend guide)。
Legend guide:
https://matplotlib.org/stable/tutorials/intermediate/legend_guide.html
样例
代码:
·
·
·
·
·
·
·
·
·
·
·
·
·
·
·
·
·
·
·
·
·
·
·
·
·
·
·
·
·
·
·
·
·
·
·
·
·
·
·
"""===============================Legend using pre-defined labels===============================
Defining legend labels with plots."""
import numpy as npimport matplotlib.pyplot as plt
# Make some fake data.a = b = np.arange(0, 3, .02)c = np.exp(a)d = c[::-1]
# Create plots with pre-defined labels.fig, ax = plt.subplots()ax.plot(a, c, 'k--', label='Model length')ax.plot(a, d, 'k:', label='Data length')ax.plot(a, c + d, 'k', label='Total message length')
legend = ax.legend(loc='upper center', shadow=True, fontsize='x-large')
# Put a nicer background color on the legend.legend.get_frame().set_facecolor('C0')
plt.show()
############################################################################### .. admonition:: References## The use of the following functions, methods, classes and modules is shown# in this example:## - `matplotlib.axes.Axes.plot` / `matplotlib.pyplot.plot`# - `matplotlib.axes.Axes.legend` / `matplotlib.pyplot.legend`
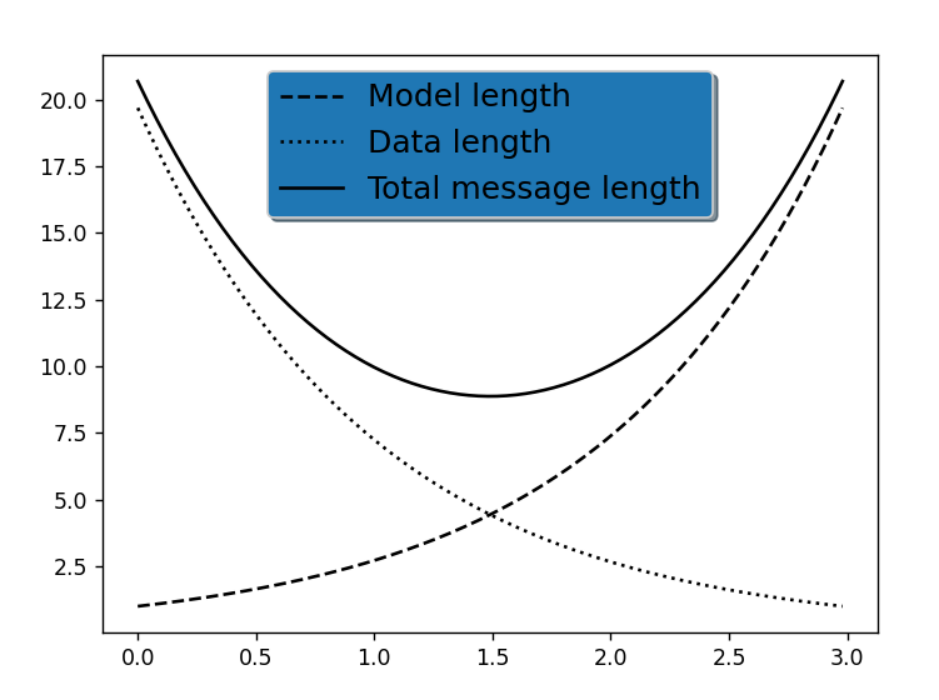
使用matplotlib.pyplot.legend的示例

Errorbar limit selection:
https://matplotlib.org/stable/gallery/lines_bars_and_markers/errorbar_limits_simple.html#sphx-glr-gallery-lines-bars-and-markers-errorbar-limits-simple-py
Plotting masked and NaN values:
https://matplotlib.org/stable/gallery/lines_bars_and_markers/masked_demo.html#sphx-glr-gallery-lines-bars-and-markers-masked-demo-py
Stairs Demo:
https://matplotlib.org/stable/gallery/lines_bars_and_markers/stairs_demo.html#sphx-glr-gallery-lines-bars-and-markers-stairs-demo-py
Step Demo:
https://matplotlib.org/stable/gallery/lines_bars_and_markers/step_demo.html#sphx-glr-gallery-lines-bars-and-markers-step-demo-py
Infinite lines:
https://matplotlib.org/stable/gallery/pyplots/axline.html#sphx-glr-gallery-pyplots-axline-py
Findobj Demo:
https://matplotlib.org/stable/gallery/misc/findobj_demo.html#sphx-glr-gallery-misc-findobj-demo-py
Zorder Demo:
https://matplotlib.org/stable/gallery/misc/zorder_demo.html#sphx-glr-gallery-misc-zorder-demo-py
The Sankey class:
https://matplotlib.org/stable/gallery/specialty_plots/sankey_basics.html#sphx-glr-gallery-specialty-plots-sankey-basics-py
SVG Histogram:
https://matplotlib.org/stable/gallery/user_interfaces/svg_histogram_sgskip.html#sphx-glr-gallery-user-interfaces-svg-histogram-sgskip-py
Quick start guide:
https://matplotlib.org/stable/tutorials/introductory/quick_start.html#sphx-glr-tutorials-introductory-quick-start-py
Legend guide:
https://matplotlib.org/stable/tutorials/intermediate/legend_guide.html#sphx-glr-tutorials-intermediate-legend-guide-py