如何使用约束布局(constrained_layout)来清晰地在图表中拟合绘图。
约束布局会自动调整子图和装饰,如图例和彩条,使它们适合图形窗口,同时尽可能保留用户要求的逻辑布局。
约束布局类似于紧凑布局(tight_layout),但使用约束求解器来确定图表域的大小,以允许它们拟合。
受约束的布局通常需要在将任何图表域(axes)添加到图表(figure)之前激活。有两种方法:
● 使用subplots()或figure()的相应参数,例如:
·
plt.subplots(layout="constrained")
● 通过rcParams激活它,如:
·
plt.rcParams['figure.constrained_layout.use'] = True
这些将在以下各节中详细描述。
简单示例
在Matplotlib中,图表域(axes)(包括子图表(subplots))的位置在标准化图表(figure)坐标中指定。轴(axis)标签或标题(有时甚至是刻度标签)可能会超出图表区域,从而被剪裁。
·
·
·
·
·
·
·
·
·
·
·
·
·
·
·
·
·
·
·
·
·
·
·
·
·
import matplotlib.pyplot as pltimport matplotlib.colors as mcolorsimport matplotlib.gridspec as gridspecimport numpy as np
plt.rcParams['savefig.facecolor'] = "0.8"plt.rcParams['figure.figsize'] = 4.5, 4.plt.rcParams['figure.max_open_warning'] = 50
def example_plot(ax, fontsize=12, hide_labels=False): ax.plot([1, 2])
ax.locator_params(nbins=3) if hide_labels: ax.set_xticklabels([]) ax.set_yticklabels([]) else: ax.set_xlabel('x-label', fontsize=fontsize) ax.set_ylabel('y-label', fontsize=fontsize) ax.set_title('Title', fontsize=fontsize)
fig, ax = plt.subplots(layout=None)example_plot(ax, fontsize=24)fig.show()

为了防止这种情况的发生,需要调整图表域(axes)的位置。对于子图表,可以使用Figure.subplots_adjust手动调整子图表参数。不过,使用layout="constrained"关键字参数指定图表能自动调整。
·
fig, ax = plt.subplots(layout="constrained")
完整代码:
·
·
·
·
·
·
·
·
·
·
·
·
·
·
·
·
·
·
·
·
·
·
·
·
·
import matplotlib.pyplot as pltimport matplotlib.colors as mcolorsimport matplotlib.gridspec as gridspecimport numpy as np
plt.rcParams['savefig.facecolor'] = "0.8"plt.rcParams['figure.figsize'] = 4.5, 4.plt.rcParams['figure.max_open_warning'] = 50
def example_plot(ax, fontsize=12, hide_labels=False): ax.plot([1, 2])
ax.locator_params(nbins=3) if hide_labels: ax.set_xticklabels([]) ax.set_yticklabels([]) else: ax.set_xlabel('x-label', fontsize=fontsize) ax.set_ylabel('y-label', fontsize=fontsize) ax.set_title('Title', fontsize=fontsize)
fig, ax = plt.subplots(layout="constrained")example_plot(ax, fontsize=24)fig.show()

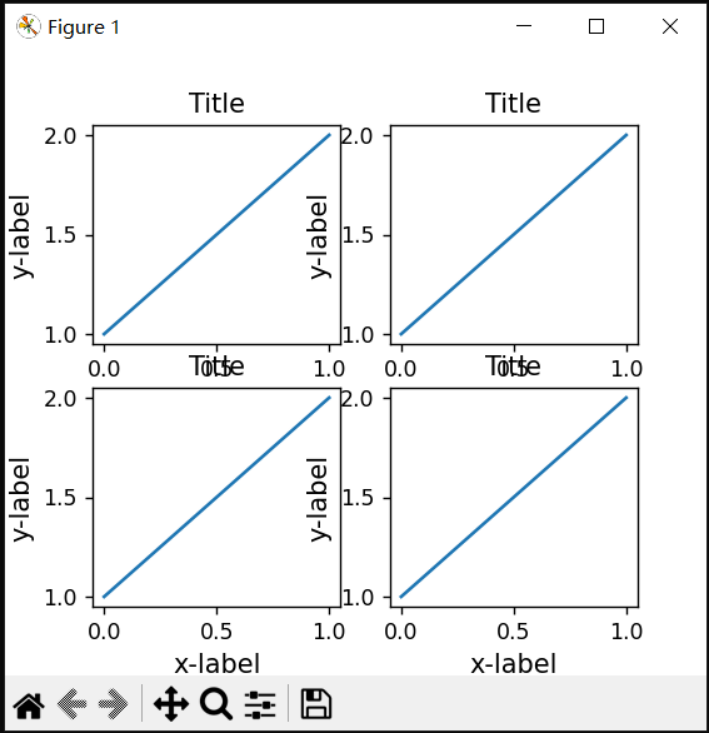
当有多个子图表时,通常会看到不同图表域(axes)的标签彼此重叠。
·
·
·
fig, axs = plt.subplots(2, 2, layout=None)for ax in axs.flat: example_plot(ax)
完整代码:
·
·
·
·
·
·
·
·
·
·
·
·
·
·
·
·
·
·
·
·
·
·
·
·
·
·
import matplotlib.pyplot as pltimport matplotlib.colors as mcolorsimport matplotlib.gridspec as gridspecimport numpy as np
plt.rcParams['savefig.facecolor'] = "0.8"plt.rcParams['figure.figsize'] = 4.5, 4.plt.rcParams['figure.max_open_warning'] = 50
def example_plot(ax, fontsize=12, hide_labels=False): ax.plot([1, 2])
ax.locator_params(nbins=3) if hide_labels: ax.set_xticklabels([]) ax.set_yticklabels([]) else: ax.set_xlabel('x-label', fontsize=fontsize) ax.set_ylabel('y-label', fontsize=fontsize) ax.set_title('Title', fontsize=fontsize)
fig, axs = plt.subplots(2, 2, layout=None)for ax in axs.flat: example_plot(ax)fig.show()

在调用plt.subplots时指定layout="constrained"会使布局受到适当约束。
·
fig, axs = plt.subplots(2, 2, layout="constrained")
完整代码:
·
·
·
·
·
·
·
·
·
·
·
·
·
·
·
·
·
·
·
·
·
·
·
·
·
·
import matplotlib.pyplot as pltimport matplotlib.colors as mcolorsimport matplotlib.gridspec as gridspecimport numpy as np
plt.rcParams['savefig.facecolor'] = "0.8"plt.rcParams['figure.figsize'] = 4.5, 4.plt.rcParams['figure.max_open_warning'] = 50
def example_plot(ax, fontsize=12, hide_labels=False): ax.plot([1, 2])
ax.locator_params(nbins=3) if hide_labels: ax.set_xticklabels([]) ax.set_yticklabels([]) else: ax.set_xlabel('x-label', fontsize=fontsize) ax.set_ylabel('y-label', fontsize=fontsize) ax.set_title('Title', fontsize=fontsize)
fig, axs = plt.subplots(2, 2, layout="constrained")for ax in axs.flat: example_plot(ax)fig.show()

色条(Colorbar)
如果用Figure.colorbar创建了一个色条,你需要为它留出空间。受约束的布局会自动完成这一操作。请注意,如果指定use_gridspec=True,则将忽略该选项,因为该选项是为了通过紧凑布局改善布局而设置的。
备注:
我们使用字典作为pcolormesh关键字参数(pc_kwargs)。下面我们将为多个图表域(axes)分配一个色条,每个图表域都包含一个ScalarMappable;指定规范和颜色映射,从而确保色条对所有图表域都是准确的。
·
·
·
·
·
·
·
arr = np.arange(100).reshape((10, 10))norm = mcolors.Normalize(vmin=0., vmax=100.)# see note above: this makes all pcolormesh calls consistent:pc_kwargs = {'rasterized': True, 'cmap': 'viridis', 'norm': norm}fig, ax = plt.subplots(figsize=(4, 4), layout="constrained")im = ax.pcolormesh(arr, **pc_kwargs)fig.colorbar(im, ax=ax, shrink=0.6)
完整代码:
·
·
·
·
·
·
·
·
·
·
·
import matplotlib.pyplot as pltimport matplotlib.colors as mcolorsimport numpy as nparr = np.arange(100).reshape((10, 10))norm = mcolors.Normalize(vmin=0., vmax=100.)# see note above: this makes all pcolormesh calls consistent:pc_kwargs = {'rasterized': True, 'cmap': 'viridis', 'norm': norm}fig, ax = plt.subplots(figsize=(4, 4), layout="constrained")im = ax.pcolormesh(arr, **pc_kwargs)fig.colorbar(im, ax=ax, shrink=0.6)fig.show()

如果为colorbar的ax参数指定了一个图表域(axes)列表(或其他可迭代容器),受约束的布局将从指定的这些图表域中获取空间。
·
·
·
·
fig, axs = plt.subplots(2, 2, figsize=(4, 4), layout="constrained")for ax in axs.flat: im = ax.pcolormesh(arr, **pc_kwargs)fig.colorbar(im, ax=axs, shrink=0.6)
完整代码:
·
·
·
·
·
·
·
·
·
·
·
·
import matplotlib.pyplot as pltimport matplotlib.colors as mcolorsimport numpy as nparr = np.arange(100).reshape((10, 10))norm = mcolors.Normalize(vmin=0., vmax=100.)# see note above: this makes all pcolormesh calls consistent:pc_kwargs = {'rasterized': True, 'cmap': 'viridis', 'norm': norm}fig, axs = plt.subplots(2, 2, figsize=(4, 4), layout="constrained")for ax in axs.flat: im = ax.pcolormesh(arr, **pc_kwargs)fig.colorbar(im, ax=axs, shrink=0.6)fig.show()

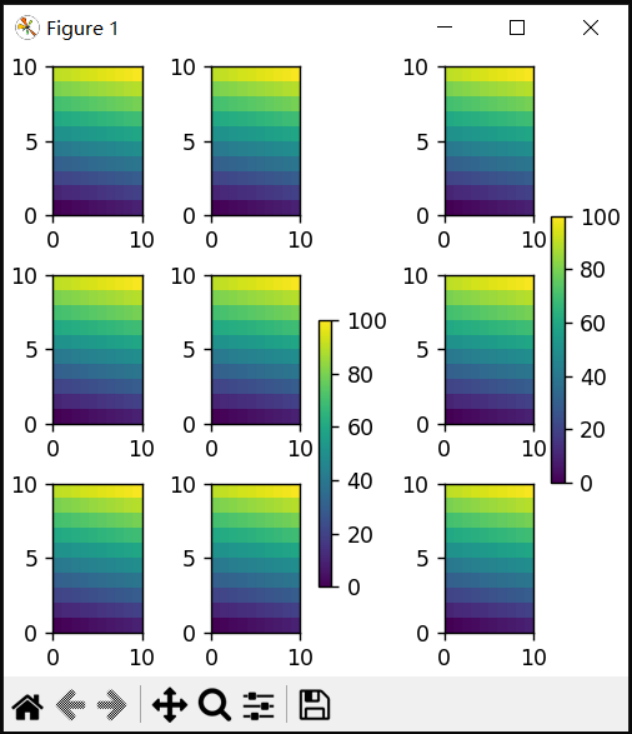
如果从图表域网格内指定图表域列表,色条将适当地占用空间,并留下间隙,但所有子图表的大小仍然相同。
·
·
·
·
·
fig, axs = plt.subplots(3, 3, figsize=(4, 4), layout="constrained")for ax in axs.flat: im = ax.pcolormesh(arr, **pc_kwargs)fig.colorbar(im, ax=axs[1:, ][:, 1], shrink=0.8)fig.colorbar(im, ax=axs[:, -1], shrink=0.6)
完整代码:
·
·
·
·
·
·
·
·
·
·
·
·
·
import matplotlib.pyplot as pltimport matplotlib.colors as mcolorsimport numpy as nparr = np.arange(100).reshape((10, 10))norm = mcolors.Normalize(vmin=0., vmax=100.)# see note above: this makes all pcolormesh calls consistent:pc_kwargs = {'rasterized': True, 'cmap': 'viridis', 'norm': norm}fig, axs = plt.subplots(3, 3, figsize=(4, 4), layout="constrained")for ax in axs.flat: im = ax.pcolormesh(arr, **pc_kwargs)fig.colorbar(im, ax=axs[1:, ][:, 1], shrink=0.8)fig.colorbar(im, ax=axs[:, -1], shrink=0.6)fig.show()

超标题
约束布局也可以为超标题( suptitle)腾出空间。
·
·
·
·
·
fig, axs = plt.subplots(2, 2, figsize=(4, 4), layout="constrained")for ax in axs.flat: im = ax.pcolormesh(arr, **pc_kwargs)fig.colorbar(im, ax=axs, shrink=0.6)fig.suptitle('Big Suptitle')
完整代码:
·
·
·
·
·
·
·
·
·
·
·
·
·
import matplotlib.pyplot as pltimport matplotlib.colors as mcolorsimport numpy as nparr = np.arange(100).reshape((10, 10))norm = mcolors.Normalize(vmin=0., vmax=100.)# see note above: this makes all pcolormesh calls consistent:pc_kwargs = {'rasterized': True, 'cmap': 'viridis', 'norm': norm}fig, axs = plt.subplots(2, 2, figsize=(4, 4), layout="constrained")for ax in axs.flat: im = ax.pcolormesh(arr, **pc_kwargs)fig.colorbar(im, ax=axs, shrink=0.6)fig.suptitle('Big Suptitle')fig.show()

图例
图例可以放置在其父坐标系之外。约束布局旨在为Axes.legend()处理此问题。然而,约束布局不处理通过Figure.legend()创建的图例。
·
·
·
fig, ax = plt.subplots(layout="constrained")ax.plot(np.arange(10), label='This is a plot')ax.legend(loc='center left', bbox_to_anchor=(0.8, 0.5))
完整代码:
·
·
·
·
·
·
import matplotlib.pyplot as pltimport numpy as npfig, ax = plt.subplots(layout="constrained")ax.plot(np.arange(10), label='This is a plot')ax.legend(loc='center left', bbox_to_anchor=(0.8, 0.5))fig.show()

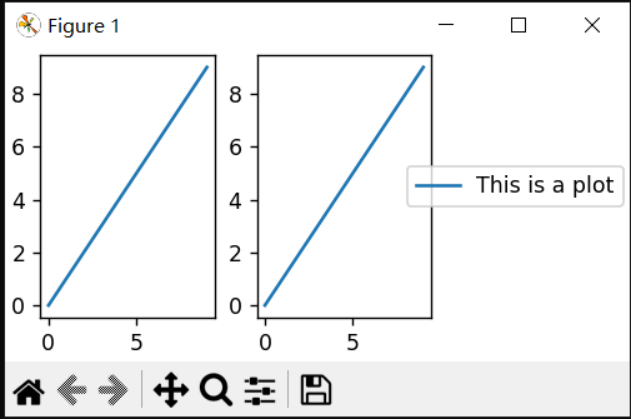
然而,这将从子图表布局中占用空间:
·
·
·
·
fig, axs = plt.subplots(1, 2, figsize=(4, 2), layout="constrained")axs[0].plot(np.arange(10))axs[1].plot(np.arange(10), label='This is a plot')axs[1].legend(loc='center left', bbox_to_anchor=(0.8, 0.5))
完整代码:
·
·
·
·
·
·
·
import matplotlib.pyplot as pltimport numpy as npfig, axs = plt.subplots(1, 2, figsize=(4, 2), layout="constrained")axs[0].plot(np.arange(10))axs[1].plot(np.arange(10), label='This is a plot')axs[1].legend(loc='center left', bbox_to_anchor=(0.8, 0.5))fig.show()

为了使图例或其他艺术家不从子图布局中窃取空间,我们可以使用leg.set_in_layout(False)。当然,这可能意味着图例最终被裁剪,但如果随后使用fig.savefig('outname.png',bbox_inches='tight')调用绘图,则会很有用。然而,请注意,图例的get_in_layout状态必须再次切换才能使保存的文件正常工作,如果我们希望约束布局在打印前调整图表域(axes)的大小,则必须手动触发绘制。
·
·
·
·
·
·
·
·
·
·
·
·
·
·
·
·
·
·
·
·
fig, axs = plt.subplots(1, 2, figsize=(4, 2), layout="constrained")
axs[0].plot(np.arange(10))axs[1].plot(np.arange(10), label='This is a plot')leg = axs[1].legend(loc='center left', bbox_to_anchor=(0.8, 0.5))leg.set_in_layout(False)# trigger a draw so that constrained_layout is executed once# before we turn it off when printing....fig.canvas.draw()# we want the legend included in the bbox_inches='tight' calcs.leg.set_in_layout(True)# we don't want the layout to change at this point.fig.set_layout_engine(None)try: fig.savefig('../../doc/_static/constrained_layout_1b.png', bbox_inches='tight', dpi=100)except FileNotFoundError: # this allows the script to keep going if run interactively and # the directory above doesn't exist pass
完整代码:
·
·
·
·
·
·
·
·
·
·
·
·
·
·
·
·
·
·
·
·
·
·
·
import matplotlib.pyplot as pltimport numpy as npfig, axs = plt.subplots(1, 2, figsize=(4, 2), layout="constrained")
axs[0].plot(np.arange(10))axs[1].plot(np.arange(10), label='This is a plot')leg = axs[1].legend(loc='center left', bbox_to_anchor=(0.8, 0.5))leg.set_in_layout(False)# trigger a draw so that constrained_layout is executed once# before we turn it off when printing....fig.canvas.draw()# we want the legend included in the bbox_inches='tight' calcs.leg.set_in_layout(True)# we don't want the layout to change at this point.fig.set_layout_engine(None)try: fig.savefig('../../doc/_static/constrained_layout_1b.png', bbox_inches='tight', dpi=100)except FileNotFoundError: # this allows the script to keep going if run interactively and # the directory above doesn't exist passfig.show()

保存的文件:

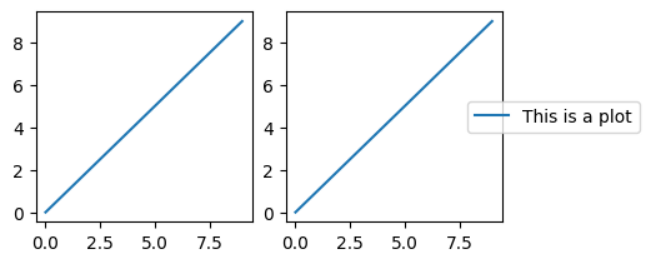
解决这种尴尬的更好方法是简单地使用Figure.legend提供的图例方法:
·
·
·
·
·
·
·
·
·
·
·
·
·
fig, axs = plt.subplots(1, 2, figsize=(4, 2), layout="constrained")axs[0].plot(np.arange(10))lines = axs[1].plot(np.arange(10), label='This is a plot')labels = [l.get_label() for l in lines]leg = fig.legend(lines, labels, loc='center left', bbox_to_anchor=(0.8, 0.5), bbox_transform=axs[1].transAxes)try: fig.savefig('../../doc/_static/constrained_layout_2b.png', bbox_inches='tight', dpi=100)except FileNotFoundError: # this allows the script to keep going if run interactively and # the directory above doesn't exist pass

保存的文件:

原文中链接
tight_layout:https://matplotlib.org/stable/tutorials/intermediate/tight_layout_guide.html
subplots():
https://matplotlib.org/stable/api/_as_gen/matplotlib.pyplot.subplots.html#matplotlib.pyplot.subplots
figure():
https://matplotlib.org/stable/api/_as_gen/matplotlib.pyplot.figure.html#matplotlib.pyplot.figure
rcParams:
https://matplotlib.org/stable/tutorials/introductory/customizing.html#customizing-with-dynamic-rc-settings
Figure.subplots_adjust:
https://matplotlib.org/stable/api/figure_api.html#matplotlib.figure.Figure.subplots_adjust
Figure.colorbar:
https://matplotlib.org/stable/api/figure_api.html#matplotlib.figure.Figure.colorbar
pcolormesh:
https://matplotlib.org/stable/api/_as_gen/matplotlib.axes.Axes.pcolormesh.html#matplotlib.axes.Axes.pcolormesh
ScalarMappable:
https://matplotlib.org/stable/api/cm_api.html#matplotlib.cm.ScalarMappable
suptitle:
https://matplotlib.org/stable/api/figure_api.html#matplotlib.figure.Figure.suptitle
Axes.legend():
https://matplotlib.org/stable/api/_as_gen/matplotlib.axes.Axes.legend.html#matplotlib.axes.Axes.legend
Figure.legend():
https://matplotlib.org/stable/api/figure_api.html#matplotlib.figure.Figure.legend