填充(Padding)和间距(Spacing)
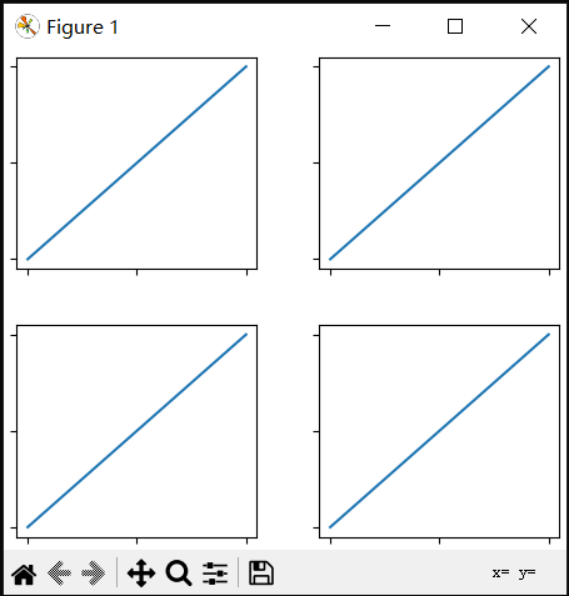
图表域之间的填充空间在水平方向上由w_pad和wspace控制,在垂直方向上由h_pad和hspace控制。这些可以通过set函数进行编辑。w/h_pad是图表域(axes)周围的最小间距,单位为英寸:
·
·
·
·
·
fig, axs = plt.subplots(2, 2, layout="constrained")for ax in axs.flat: example_plot(ax, hide_labels=True)fig.get_layout_engine().set(w_pad=4 / 72, h_pad=4 / 72, hspace=0, wspace=0)
完整代码:
·
·
·
·
·
·
·
·
·
·
·
·
·
·
·
·
·
·
·
·
·
·
·
·
·
·
·
·
·
ipython%matplotlib tkimport matplotlib.pyplot as pltimport matplotlib.colors as mcolorsimport matplotlib.gridspec as gridspecimport numpy as np
plt.rcParams['savefig.facecolor'] = "0.8"plt.rcParams['figure.figsize'] = 4.5, 4.plt.rcParams['figure.max_open_warning'] = 50
def example_plot(ax, fontsize=12, hide_labels=False): ax.plot([1, 2])
ax.locator_params(nbins=3) if hide_labels: ax.set_xticklabels([]) ax.set_yticklabels([]) else: ax.set_xlabel('x-label', fontsize=fontsize) ax.set_ylabel('y-label', fontsize=fontsize) ax.set_title('Title', fontsize=fontsize)
fig, axs = plt.subplots(2, 2, layout="constrained")for ax in axs.flat: example_plot(ax, hide_labels=True)fig.get_layout_engine().set(w_pad=4 / 72, h_pad=4 / 72, hspace=0, wspace=0)

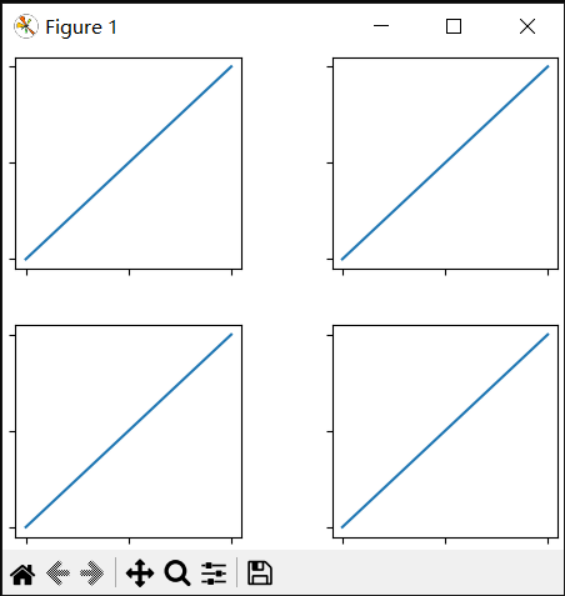
子图表之间的间距由wspace和hspace进一步设置。这些被指定为整个子图表组(一行或一列子图表)大小的一部分。如果这些值小于w_pad或h_pad,则使用固定填充空间。请注意,通过观察下面的图表,会发现边缘处的空间与上面的图表没有变化,但子图表之间的空间发生了变化。这就是w/hspace与w/h_pad的不同。
·
·
·
·
·
fig, axs = plt.subplots(2, 2, layout="constrained")for ax in axs.flat: example_plot(ax, hide_labels=True)fig.get_layout_engine().set(w_pad=4 / 72, h_pad=4 / 72, hspace=0.2, wspace=0.2)
完整代码:
·
·
·
·
·
·
·
·
·
·
·
·
·
·
·
·
·
·
·
·
·
·
·
·
·
·
·
·
·
ipython%matplotlib tkimport matplotlib.pyplot as pltimport matplotlib.colors as mcolorsimport matplotlib.gridspec as gridspecimport numpy as np
plt.rcParams['savefig.facecolor'] = "0.8"plt.rcParams['figure.figsize'] = 4.5, 4.plt.rcParams['figure.max_open_warning'] = 50
def example_plot(ax, fontsize=12, hide_labels=False): ax.plot([1, 2])
ax.locator_params(nbins=3) if hide_labels: ax.set_xticklabels([]) ax.set_yticklabels([]) else: ax.set_xlabel('x-label', fontsize=fontsize) ax.set_ylabel('y-label', fontsize=fontsize) ax.set_title('Title', fontsize=fontsize)
fig, axs = plt.subplots(2, 2, layout="constrained")fig.get_layout_engine().set(w_pad=4 / 72, h_pad=4 / 72, hspace=0.2, wspace=0.2)for ax in axs.flat: example_plot(ax, hide_labels=True)

如果超过两列,则wspace在列间隔之间共享,因此下面的例子,wspace被分成两份,每份的wspace为0.1:
·
·
·
·
·
fig, axs = plt.subplots(2, 3, layout="constrained")for ax in axs.flat: example_plot(ax, hide_labels=True)fig.get_layout_engine().set(w_pad=4 / 72, h_pad=4 / 72, hspace=0.2, wspace=0.2)
完整代码:
·
·
·
·
·
·
·
·
·
·
·
·
·
·
·
·
·
·
·
·
·
·
·
·
·
·
·
·
ipython%matplotlib tkimport matplotlib.pyplot as pltimport matplotlib.colors as mcolorsimport matplotlib.gridspec as gridspecimport numpy as np
plt.rcParams['savefig.facecolor'] = "0.8"plt.rcParams['figure.figsize'] = 4.5, 4.plt.rcParams['figure.max_open_warning'] = 50
def example_plot(ax, fontsize=12, hide_labels=False): ax.plot([1, 2])
ax.locator_params(nbins=3) if hide_labels: ax.set_xticklabels([]) ax.set_yticklabels([]) else: ax.set_xlabel('x-label', fontsize=fontsize) ax.set_ylabel('y-label', fontsize=fontsize) ax.set_title('Title', fontsize=fontsize)fig, axs = plt.subplots(2, 3, layout="constrained")fig.get_layout_engine().set(w_pad=4 / 72, h_pad=4 / 72, hspace=0.2, wspace=0.2)for ax in axs.flat: example_plot(ax, hide_labels=True)

GridSpec还具有可选的hspace和wspace关键字参数,这些参数将用于代替constrained_layout设置的pad:
·
·
·
·
·
·
·
·
fig, axs = plt.subplots(2, 2, layout="constrained", gridspec_kw={'wspace': 0.3, 'hspace': 0.2})# this has no effect because the space set in the gridspec trumps the# space set in constrained_layout.fig.get_layout_engine().set(w_pad=4 / 72, h_pad=4 / 72, hspace=0.0, wspace=0.0)for ax in axs.flat: example_plot(ax, hide_labels=True)
完整代码:
·
·
·
·
·
·
·
·
·
·
·
·
·
·
·
·
·
·
·
·
·
·
·
·
·
·
·
·
·
·
·
ipython%matplotlib tkimport matplotlib.pyplot as pltimport matplotlib.colors as mcolorsimport matplotlib.gridspec as gridspecimport numpy as np
plt.rcParams['savefig.facecolor'] = "0.8"plt.rcParams['figure.figsize'] = 4.5, 4.plt.rcParams['figure.max_open_warning'] = 50
def example_plot(ax, fontsize=12, hide_labels=False): ax.plot([1, 2])
ax.locator_params(nbins=3) if hide_labels: ax.set_xticklabels([]) ax.set_yticklabels([]) else: ax.set_xlabel('x-label', fontsize=fontsize) ax.set_ylabel('y-label', fontsize=fontsize) ax.set_title('Title', fontsize=fontsize)fig, axs = plt.subplots(2, 2, layout="constrained", gridspec_kw={'wspace': 0.3, 'hspace': 0.2})# this has no effect because the space set in the gridspec trumps the# space set in constrained_layout.fig.get_layout_engine().set(w_pad=4 / 72, h_pad=4 / 72, hspace=0.0, wspace=0.0)for ax in axs.flat: example_plot(ax, hide_labels=True)

与色条的间距
色条与父对象之间有一定距离的填充空间(pad),该填充空间是父对象宽度的一部分。然后通过w/hspace给出到下一个子图表的间距。
·
·
·
·
·
·
·
·
·
·
fig, axs = plt.subplots(2, 2, layout="constrained")pads = [0, 0.05, 0.1, 0.2]for pad, ax in zip(pads, axs.flat): pc = ax.pcolormesh(arr, **pc_kwargs) fig.colorbar(pc, ax=ax, shrink=0.6, pad=pad) ax.set_xticklabels([]) ax.set_yticklabels([]) ax.set_title(f'pad: {pad}')fig.get_layout_engine().set(w_pad=2 / 72, h_pad=2 / 72, hspace=0.2, wspace=0.2)
完整代码:
·
·
·
·
·
·
·
·
·
·
·
·
·
·
·
·
·
·
·
ipython%matplotlib tkimport matplotlib.pyplot as pltimport matplotlib.colors as mcolorsimport numpy as nparr = np.arange(100).reshape((10, 10))norm = mcolors.Normalize(vmin=0., vmax=100.)# see note above: this makes all pcolormesh calls consistent:pc_kwargs = {'rasterized': True, 'cmap': 'viridis', 'norm': norm}fig, axs = plt.subplots(2, 2, layout="constrained")pads = [0, 0.05, 0.1, 0.2]for pad, ax in zip(pads, axs.flat): pc = ax.pcolormesh(arr, **pc_kwargs) fig.colorbar(pc, ax=ax, shrink=0.6, pad=pad) ax.set_xticklabels([]) ax.set_yticklabels([]) ax.set_title(f'pad: {pad}')fig.get_layout_engine().set(w_pad=2 / 72, h_pad=2 / 72, hspace=0.2, wspace=0.2)

rcParams(rc参数)
可以在脚本或matplotlibrc文件中设置五个rcParams。它们都有前缀figure.constrained_layout:
● use:是否使用constrained_layout。默认值为False
● w_pad,h_pad:围绕图表域(axes)对象填充空白。表示英寸的浮点数。默认值为3./72。英寸(3分)
● wspace,hspace:子图表组之间的空隔。浮点数表示要分隔的子图表宽度的一部分。默认值为0.02。
·
·
·
·
plt.rcParams['figure.constrained_layout.use'] = Truefig, axs = plt.subplots(2, 2, figsize=(3, 3))for ax in axs.flat: example_plot(ax)
完整代码:
·
·
·
·
·
·
·
·
·
·
·
·
·
·
·
·
·
·
·
·
·
·
·
·
·
ipython%matplotlib tkimport matplotlib.pyplot as pltimport matplotlib.colors as mcolorsimport matplotlib.gridspec as gridspecimport numpy as np
plt.rcParams['savefig.facecolor'] = "0.8"plt.rcParams['figure.figsize'] = 4.5, 4.plt.rcParams['figure.max_open_warning'] = 50
def example_plot(ax, fontsize=12, hide_labels=False): ax.plot([1, 2]) ax.locator_params(nbins=3) if hide_labels: ax.set_xticklabels([]) ax.set_yticklabels([]) else: ax.set_xlabel('x-label', fontsize=fontsize) ax.set_ylabel('y-label', fontsize=fontsize) ax.set_title('Title', fontsize=fontsize)plt.rcParams['figure.constrained_layout.use'] = Truefig, axs = plt.subplots(2, 2, figsize=(3, 3))for ax in axs.flat: example_plot(ax)

与网格排版(GridSpec)一起使用
约束布局用于subplots()、subplot_mosaic(),或用于带GridSpec()的add_subplot()。
注意,在以下布局中,layout="constrained"。
·
·
·
·
·
·
·
·
·
plt.rcParams['figure.constrained_layout.use'] = Falsefig = plt.figure(layout="constrained")
gs1 = gridspec.GridSpec(2, 1, figure=fig)ax1 = fig.add_subplot(gs1[0])ax2 = fig.add_subplot(gs1[1])
example_plot(ax1)example_plot(ax2)
完整代码:
·
·
·
·
·
·
·
·
·
·
·
·
·
·
·
·
·
·
·
·
·
·
·
·
·
·
·
·
·
·
ipython%matplotlib tkimport matplotlib.pyplot as pltimport matplotlib.colors as mcolorsimport matplotlib.gridspec as gridspecimport numpy as np
plt.rcParams['savefig.facecolor'] = "0.8"plt.rcParams['figure.figsize'] = 4.5, 4.plt.rcParams['figure.max_open_warning'] = 50
def example_plot(ax, fontsize=12, hide_labels=False): ax.plot([1, 2]) ax.locator_params(nbins=3) if hide_labels: ax.set_xticklabels([]) ax.set_yticklabels([]) else: ax.set_xlabel('x-label', fontsize=fontsize) ax.set_ylabel('y-label', fontsize=fontsize) ax.set_title('Title', fontsize=fontsize)plt.rcParams['figure.constrained_layout.use'] = Falsefig = plt.figure(layout="constrained")
gs1 = gridspec.GridSpec(2, 1, figure=fig)ax1 = fig.add_subplot(gs1[0])ax2 = fig.add_subplot(gs1[1])
example_plot(ax1)example_plot(ax2)

更复杂的网格布局是可能的。注意这里我们使用了便利函数add_gridspec和subgridspec。
·
·
·
·
·
·
·
·
·
·
·
·
·
·
·
·
·
·
·
·
fig = plt.figure(layout="constrained")
gs0 = fig.add_gridspec(1, 2)
gs1 = gs0[0].subgridspec(2, 1)ax1 = fig.add_subplot(gs1[0])ax2 = fig.add_subplot(gs1[1])
example_plot(ax1)example_plot(ax2)
gs2 = gs0[1].subgridspec(3, 1)
for ss in gs2: ax = fig.add_subplot(ss) example_plot(ax) ax.set_title("") ax.set_xlabel("")
ax.set_xlabel("x-label", fontsize=12)
完整代码:
·
·
·
·
·
·
·
·
·
·
·
·
·
·
·
·
·
·
·
·
·
·
·
·
·
·
·
·
·
·
·
·
·
·
·
·
·
·
·
·
·
ipython%matplotlib tkimport matplotlib.pyplot as pltimport matplotlib.colors as mcolorsimport matplotlib.gridspec as gridspecimport numpy as np
plt.rcParams['savefig.facecolor'] = "0.8"plt.rcParams['figure.figsize'] = 4.5, 4.plt.rcParams['figure.max_open_warning'] = 50
def example_plot(ax, fontsize=12, hide_labels=False): ax.plot([1, 2]) ax.locator_params(nbins=3) if hide_labels: ax.set_xticklabels([]) ax.set_yticklabels([]) else: ax.set_xlabel('x-label', fontsize=fontsize) ax.set_ylabel('y-label', fontsize=fontsize) ax.set_title('Title', fontsize=fontsize)fig = plt.figure(layout="constrained")
gs0 = fig.add_gridspec(1, 2)
gs1 = gs0[0].subgridspec(2, 1)ax1 = fig.add_subplot(gs1[0])ax2 = fig.add_subplot(gs1[1])
example_plot(ax1)example_plot(ax2)
gs2 = gs0[1].subgridspec(3, 1)
for ss in gs2: ax = fig.add_subplot(ss) example_plot(ax) ax.set_title("") ax.set_xlabel("")
ax.set_xlabel("x-label", fontsize=12)

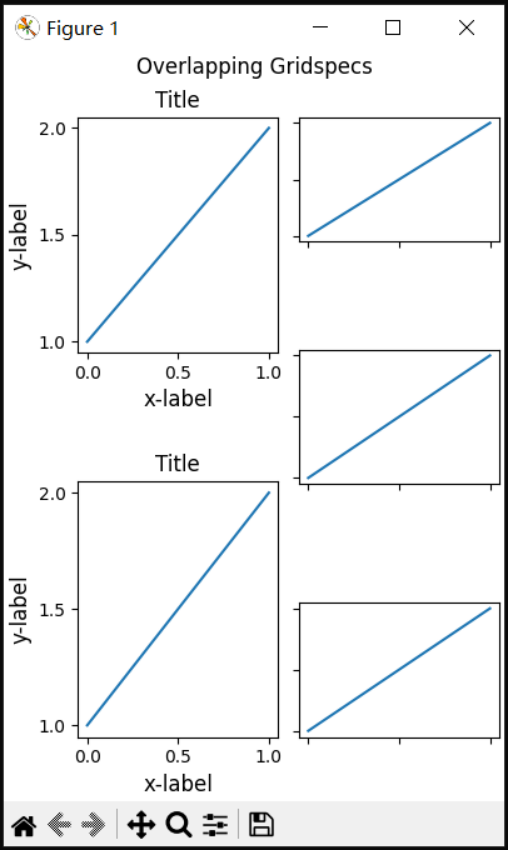
请注意,在上面的图表中,左列和右列的垂直范围不相同。如果我们希望两个网格的顶部和底部对齐,那么它们需要在同一个网格布局中。我们还需要将此图表放大,以使图表域(axes)不会塌陷到零高度:
·
·
·
·
·
·
·
·
·
·
·
·
·
·
·
·
·
fig = plt.figure(figsize=(4, 6), layout="constrained")
gs0 = fig.add_gridspec(6, 2) #6行2列
ax1 = fig.add_subplot(gs0[:3, 0]) #合并第1列的第1行到第3行ax2 = fig.add_subplot(gs0[3:, 0]) #合并第1列的第4行到第6行
example_plot(ax1)example_plot(ax2)
ax = fig.add_subplot(gs0[0:2, 1]) #合并第2列的第1行到第2行example_plot(ax, hide_labels=True)ax = fig.add_subplot(gs0[2:4, 1]) #合并第2列的第3行到第4行example_plot(ax, hide_labels=True)ax = fig.add_subplot(gs0[4:, 1]) #合并第2列的第5行到第6行example_plot(ax, hide_labels=True)fig.suptitle('Overlapping Gridspecs')
完整代码:
·
·
·
·
·
·
·
·
·
·
·
·
·
·
·
·
·
·
·
·
·
·
·
·
·
·
·
·
·
·
·
·
·
·
·
·
·
·
·
ipython%matplotlib tkimport matplotlib.pyplot as pltimport matplotlib.colors as mcolorsimport matplotlib.gridspec as gridspecimport numpy as np
plt.rcParams['savefig.facecolor'] = "0.8"plt.rcParams['figure.figsize'] = 4.5, 4.plt.rcParams['figure.max_open_warning'] = 50
def example_plot(ax, fontsize=12, hide_labels=False): ax.plot([1, 2]) ax.locator_params(nbins=3) if hide_labels: ax.set_xticklabels([]) ax.set_yticklabels([]) else: ax.set_xlabel('x-label', fontsize=fontsize) ax.set_ylabel('y-label', fontsize=fontsize) ax.set_title('Title', fontsize=fontsize)
fig = plt.figure(figsize=(4, 6), layout="constrained")
gs0 = fig.add_gridspec(6, 2)
ax1 = fig.add_subplot(gs0[:3, 0])ax2 = fig.add_subplot(gs0[3:, 0])
example_plot(ax1)example_plot(ax2)
ax = fig.add_subplot(gs0[0:2, 1])example_plot(ax, hide_labels=True)ax = fig.add_subplot(gs0[2:4, 1])example_plot(ax, hide_labels=True)ax = fig.add_subplot(gs0[4:, 1])example_plot(ax, hide_labels=True)fig.suptitle('Overlapping Gridspecs')

下面的示例使用两个网格,以使色条仅适用于一组颜色。请注意,由于这一点,左侧的列比右侧的两列宽。当然,如果你想让子图表大小相同,你只需要一个网格布局。请注意,使用subfigures(子图表)可以实现相同的效果。
·
·
·
·
·
·
·
·
·
·
·
·
·
·
·
·
·
·
fig = plt.figure(layout="constrained")gs0 = fig.add_gridspec(1, 2, figure=fig, width_ratios=[1, 2])gs_left = gs0[0].subgridspec(2, 1)gs_right = gs0[1].subgridspec(2, 2)
for gs in gs_left: ax = fig.add_subplot(gs) example_plot(ax)axs = []for gs in gs_right: ax = fig.add_subplot(gs) pcm = ax.pcolormesh(arr, **pc_kwargs) ax.set_xlabel('x-label') ax.set_ylabel('y-label') ax.set_title('title') axs += [ax]fig.suptitle('Nested plots using subgridspec')fig.colorbar(pcm, ax=axs)
完整代码:
·
·
·
·
·
·
·
·
·
·
·
·
·
·
·
·
·
·
·
·
·
·
·
·
·
·
·
·
·
·
·
·
·
·
·
·
·
·
·
·
·
·
·
·
ipython%matplotlib tkimport matplotlib.pyplot as pltimport matplotlib.colors as mcolorsimport matplotlib.gridspec as gridspecimport numpy as nparr = np.arange(100).reshape((10, 10))norm = mcolors.Normalize(vmin=0., vmax=100.)# see note above: this makes all pcolormesh calls consistent:pc_kwargs = {'rasterized': True, 'cmap': 'viridis', 'norm': norm}
plt.rcParams['savefig.facecolor'] = "0.8"plt.rcParams['figure.figsize'] = 4.5, 4.plt.rcParams['figure.max_open_warning'] = 50
def example_plot(ax, fontsize=12, hide_labels=False): ax.plot([1, 2]) ax.locator_params(nbins=3) if hide_labels: ax.set_xticklabels([]) ax.set_yticklabels([]) else: ax.set_xlabel('x-label', fontsize=fontsize) ax.set_ylabel('y-label', fontsize=fontsize) ax.set_title('Title', fontsize=fontsize)
fig = plt.figure(layout="constrained")gs0 = fig.add_gridspec(1, 2, figure=fig, width_ratios=[1, 2])gs_left = gs0[0].subgridspec(2, 1)gs_right = gs0[1].subgridspec(2, 2)
for gs in gs_left: ax = fig.add_subplot(gs) example_plot(ax)axs = []for gs in gs_right: ax = fig.add_subplot(gs) pcm = ax.pcolormesh(arr, **pc_kwargs) ax.set_xlabel('x-label') ax.set_ylabel('y-label') ax.set_title('title') axs += [ax]fig.suptitle('Nested plots using subgridspec')fig.colorbar(pcm, ax=axs)

除了subgridspec,Matplotlib现在也提供了subfigures(子图表)功能,同样使用父图表的布局(约束布局):
·
·
·
·
·
·
·
·
·
·
·
·
·
·
·
fig = plt.figure(layout="constrained")sfigs = fig.subfigures(1, 2, width_ratios=[1, 2])
axs_left = sfigs[0].subplots(2, 1)for ax in axs_left.flat: example_plot(ax)
axs_right = sfigs[1].subplots(2, 2)for ax in axs_right.flat: pcm = ax.pcolormesh(arr, **pc_kwargs) ax.set_xlabel('x-label') ax.set_ylabel('y-label') ax.set_title('title')fig.colorbar(pcm, ax=axs_right)fig.suptitle('Nested plots using subfigures')
完整代码:
·
·
·
·
·
·
·
·
·
·
·
·
·
·
·
·
·
·
·
·
·
·
·
·
·
·
·
·
·
·
·
·
·
·
·
·
·
·
·
·
·
ipython%matplotlib tkimport matplotlib.pyplot as pltimport matplotlib.colors as mcolorsimport matplotlib.gridspec as gridspecimport numpy as nparr = np.arange(100).reshape((10, 10))norm = mcolors.Normalize(vmin=0., vmax=100.)# see note above: this makes all pcolormesh calls consistent:pc_kwargs = {'rasterized': True, 'cmap': 'viridis', 'norm': norm}
plt.rcParams['savefig.facecolor'] = "0.8"plt.rcParams['figure.figsize'] = 4.5, 4.plt.rcParams['figure.max_open_warning'] = 50
def example_plot(ax, fontsize=12, hide_labels=False): ax.plot([1, 2]) ax.locator_params(nbins=3) if hide_labels: ax.set_xticklabels([]) ax.set_yticklabels([]) else: ax.set_xlabel('x-label', fontsize=fontsize) ax.set_ylabel('y-label', fontsize=fontsize) ax.set_title('Title', fontsize=fontsize)
fig = plt.figure(layout="constrained")sfigs = fig.subfigures(1, 2, width_ratios=[1, 2])
axs_left = sfigs[0].subplots(2, 1)for ax in axs_left.flat: example_plot(ax)
axs_right = sfigs[1].subplots(2, 2)for ax in axs_right.flat: pcm = ax.pcolormesh(arr, **pc_kwargs) ax.set_xlabel('x-label') ax.set_ylabel('y-label') ax.set_title('title')fig.colorbar(pcm, ax=axs_right)fig.suptitle('Nested plots using subfigures')

set:
https://matplotlib.org/stable/api/layout_engine_api.html#matplotlib.layout_engine.ConstrainedLayoutEngine.set
rcParams:
https://matplotlib.org/stable/tutorials/introductory/customizing.html#customizing-with-dynamic-rc-settings
subplots():
https://matplotlib.org/stable/api/figure_api.html#matplotlib.figure.Figure.subplots
subplot_mosaic():
https://matplotlib.org/stable/api/figure_api.html#matplotlib.figure.Figure.subplot_mosaic
GridSpec():
https://matplotlib.org/stable/api/_as_gen/matplotlib.gridspec.GridSpec.html#matplotlib.gridspec.GridSpec
add_subplot():
https://matplotlib.org/stable/api/figure_api.html#matplotlib.figure.Figure.add_subplot
add_gridspec:
https://matplotlib.org/stable/api/figure_api.html#matplotlib.figure.Figure.add_gridspec
subgridspec:
https://matplotlib.org/stable/api/_as_gen/matplotlib.gridspec.SubplotSpec.html#matplotlib.gridspec.SubplotSpec.subgridspec
subfigures:
https://matplotlib.org/stable/api/figure_api.html#matplotlib.figure.Figure.subfigures