简单案例:单图表域(Axes)
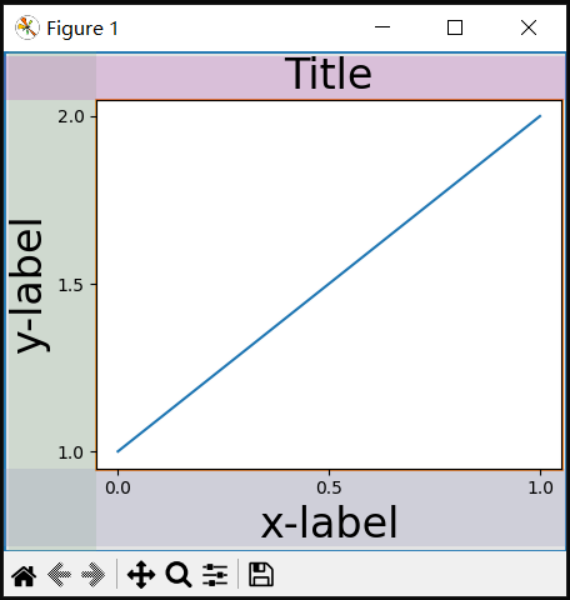
对于单个图表域,布局是直接向前的。图表有一个父布局网格,由一列和一行组成,包含图表域的网格有一个子布局网格,同样由一行和一列组成。在图表域的每一侧都为“装饰”留出了空间。在下面代码中,这是通过do_constrained_layout() 中的条目实现的,如:
·
·
gridspec._layoutgrid[0, 0].edit_margin_min('left', -bbox.x0 + pos.x0 + w_pad)
其中bbox是图表域的紧密边界框,pos是它的位置。注意四个边距如何包含图表域的装饰。
·
·
·
·
·
from matplotlib._layoutgrid import plot_children
fig, ax = plt.subplots(layout="constrained")example_plot(ax, fontsize=24)plot_children(fig)
完整代码:
·
·
·
·
·
·
·
·
·
·
·
·
·
·
·
·
·
·
·
·
·
·
·
·
·
·
·
·
ipython%matplotlib tkimport matplotlib.pyplot as pltimport matplotlib.colors as mcolorsimport matplotlib.gridspec as gridspecimport numpy as np
plt.rcParams['savefig.facecolor'] = "0.8"plt.rcParams['figure.figsize'] = 4.5, 4.plt.rcParams['figure.max_open_warning'] = 50
def example_plot(ax, fontsize=12, hide_labels=False): ax.plot([1, 2]) ax.locator_params(nbins=3) if hide_labels: ax.set_xticklabels([]) ax.set_yticklabels([]) else: ax.set_xlabel('x-label', fontsize=fontsize) ax.set_ylabel('y-label', fontsize=fontsize) ax.set_title('Title', fontsize=fontsize)
from matplotlib._layoutgrid import plot_children
fig, ax = plt.subplots(layout="constrained")example_plot(ax, fontsize=24)plot_children(fig)

简单案例:两个图表域(Axes)
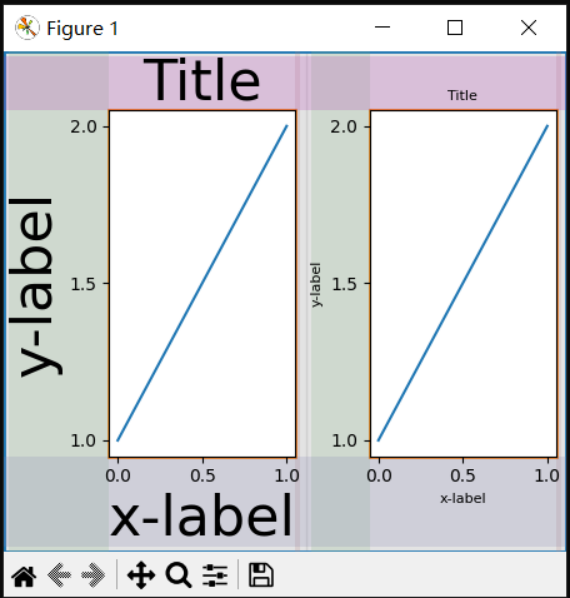
当有多个图表域时,它们的布局以简单的方式绑定。在本例中,左图表的装饰比右图表域大得多,但它们共享一个底部边距,该边距足够大,可以容纳更大的xlabel。与共享上边距相同。左右边距不共享,因此允许不同。
·
·
·
·
fig, ax = plt.subplots(1, 2, layout="constrained")example_plot(ax[0], fontsize=32)example_plot(ax[1], fontsize=8)plot_children(fig)
完整代码:
·
·
·
·
·
·
·
·
·
·
·
·
·
·
·
·
·
·
·
·
·
·
·
·
·
·
·
·
·
ipython%matplotlib tkimport matplotlib.pyplot as pltimport matplotlib.colors as mcolorsimport matplotlib.gridspec as gridspecimport numpy as np
plt.rcParams['savefig.facecolor'] = "0.8"plt.rcParams['figure.figsize'] = 4.5, 4.plt.rcParams['figure.max_open_warning'] = 50
def example_plot(ax, fontsize=12, hide_labels=False): ax.plot([1, 2]) ax.locator_params(nbins=3) if hide_labels: ax.set_xticklabels([]) ax.set_yticklabels([]) else: ax.set_xlabel('x-label', fontsize=fontsize) ax.set_ylabel('y-label', fontsize=fontsize) ax.set_title('Title', fontsize=fontsize)
from matplotlib._layoutgrid import plot_children
fig, ax = plt.subplots(1, 2, layout="constrained")example_plot(ax[0], fontsize=32)example_plot(ax[1], fontsize=8)plot_children(fig)

两个图表域和色条
色条只是扩展父布局网格单元格边距的另一项:
·
·
·
·
·
fig, ax = plt.subplots(1, 2, layout="constrained")im = ax[0].pcolormesh(arr, **pc_kwargs)fig.colorbar(im, ax=ax[0], shrink=0.6)im = ax[1].pcolormesh(arr, **pc_kwargs)plot_children(fig)
完整代码:
·
·
·
·
·
·
·
·
·
·
·
·
·
·
·
ipython%matplotlib tkimport matplotlib.pyplot as pltimport matplotlib.colors as mcolorsimport numpy as nparr = np.arange(100).reshape((10, 10))norm = mcolors.Normalize(vmin=0., vmax=100.)# see note above: this makes all pcolormesh calls consistent:pc_kwargs = {'rasterized': True, 'cmap': 'viridis', 'norm': norm}fig, ax = plt.subplots(1, 2, layout="constrained")im = ax[0].pcolormesh(arr, **pc_kwargs)fig.colorbar(im, ax=ax[0], shrink=0.6)im = ax[1].pcolormesh(arr, **pc_kwargs)from matplotlib._layoutgrid import plot_childrenplot_children(fig)

与Gridspec关联的色条
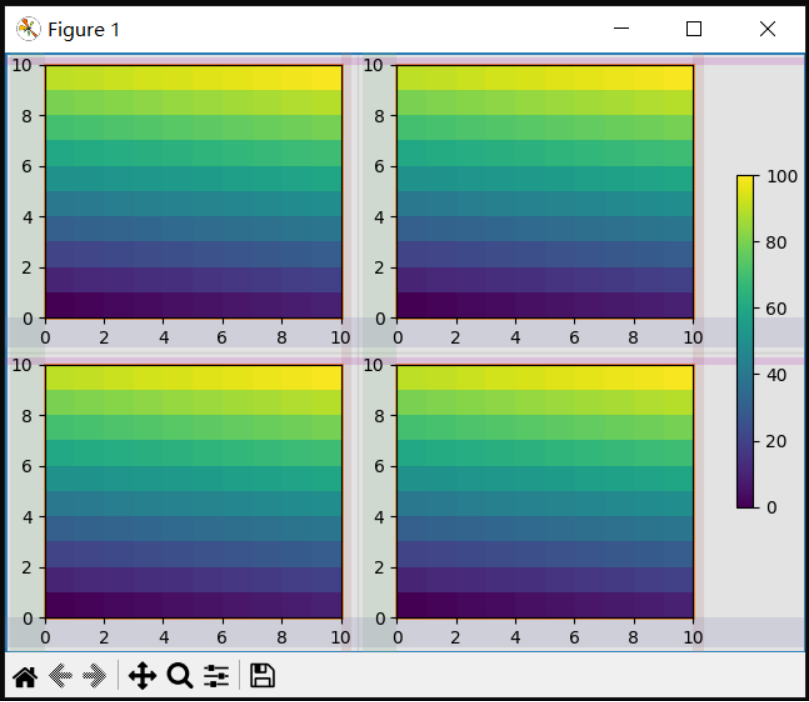
如果一个色条属于网格中的多个单元格,那么它会为每个单元格留出更大的边距:
·
·
·
·
·
fig, axs = plt.subplots(2, 2, layout="constrained")for ax in axs.flat: im = ax.pcolormesh(arr, **pc_kwargs)fig.colorbar(im, ax=axs, shrink=0.6)plot_children(fig)
完整代码:
·
·
·
·
·
·
·
·
·
·
·
·
·
·
·
ipython%matplotlib tkimport matplotlib.pyplot as pltimport matplotlib.colors as mcolorsimport numpy as nparr = np.arange(100).reshape((10, 10))norm = mcolors.Normalize(vmin=0., vmax=100.)# see note above: this makes all pcolormesh calls consistent:pc_kwargs = {'rasterized': True, 'cmap': 'viridis', 'norm': norm}fig, axs = plt.subplots(2, 2, layout="constrained")for ax in axs.flat: im = ax.pcolormesh(arr, **pc_kwargs)fig.colorbar(im, ax=axs, shrink=0.6)from matplotlib._layoutgrid import plot_childrenplot_children(fig)

不同大小的图表域(Axes)
有两种方法可以使图表域在Gridpec布局中具有不同的大小,可以通过指定它们与Gridpec行或列交叉,也可以通过指定宽度和高度比率。
下面的例子使用第一种方法。请注意,中间的上下边距不受左侧列的影响。这是算法的一个有意为之,这样能保持两个右边的图表域具有相同的高度,但不是左边图表域高度的1/2。这与gridspec在无约束布局的情况下的工作方式一致。
·
·
·
·
·
·
·
·
·
fig = plt.figure(layout="constrained")gs = gridspec.GridSpec(2, 2, figure=fig)ax = fig.add_subplot(gs[:, 0])im = ax.pcolormesh(arr, **pc_kwargs)ax = fig.add_subplot(gs[0, 1])im = ax.pcolormesh(arr, **pc_kwargs)ax = fig.add_subplot(gs[1, 1])im = ax.pcolormesh(arr, **pc_kwargs)plot_children(fig)
完整代码:
·
·
·
·
·
·
·
·
·
·
·
·
·
·
·
·
·
·
·
·
ipython%matplotlib tkimport matplotlib.pyplot as pltimport matplotlib.colors as mcolorsimport matplotlib.gridspec as gridspecimport numpy as nparr = np.arange(100).reshape((10, 10))norm = mcolors.Normalize(vmin=0., vmax=100.)# see note above: this makes all pcolormesh calls consistent:pc_kwargs = {'rasterized': True, 'cmap': 'viridis', 'norm': norm}fig = plt.figure(layout="constrained")gs = gridspec.GridSpec(2, 2, figure=fig)ax = fig.add_subplot(gs[:, 0])im = ax.pcolormesh(arr, **pc_kwargs)ax = fig.add_subplot(gs[0, 1])im = ax.pcolormesh(arr, **pc_kwargs)ax = fig.add_subplot(gs[1, 1])im = ax.pcolormesh(arr, **pc_kwargs)from matplotlib._layoutgrid import plot_childrenplot_children(fig)

一种需要巧妙处理的情况是,没有任何艺术家限制边距宽度应该怎么办。在下面的例子中,第0列的右边距和第3列的左边距没有边距艺术家来设置它们的宽度,因此取有艺术家的边距宽度的最大宽度。这使所有图表域具有相同的大小:
·
·
·
·
·
·
·
·
fig = plt.figure(layout="constrained")gs = fig.add_gridspec(2, 4)ax00 = fig.add_subplot(gs[0, 0:2])ax01 = fig.add_subplot(gs[0, 2:])ax10 = fig.add_subplot(gs[1, 1:3])example_plot(ax10, fontsize=14)plot_children(fig)plt.show()
完整代码:
·
·
·
·
·
·
·
·
·
·
·
·
·
·
·
·
·
·
·
·
·
·
·
·
·
·
·
·
·
·
·
·
·
ipython%matplotlib tkimport matplotlib.pyplot as pltimport matplotlib.colors as mcolorsimport matplotlib.gridspec as gridspecimport numpy as np
plt.rcParams['savefig.facecolor'] = "0.8"plt.rcParams['figure.figsize'] = 4.5, 4.plt.rcParams['figure.max_open_warning'] = 50
def example_plot(ax, fontsize=12, hide_labels=False): ax.plot([1, 2]) ax.locator_params(nbins=3) if hide_labels: ax.set_xticklabels([]) ax.set_yticklabels([]) else: ax.set_xlabel('x-label', fontsize=fontsize) ax.set_ylabel('y-label', fontsize=fontsize) ax.set_title('Title', fontsize=fontsize)
from matplotlib._layoutgrid import plot_children
fig = plt.figure(layout="constrained")gs = fig.add_gridspec(2, 4)ax00 = fig.add_subplot(gs[0, 0:2])ax01 = fig.add_subplot(gs[0, 2:])ax10 = fig.add_subplot(gs[1, 1:3])example_plot(ax10, fontsize=14)plot_children(fig)plt.show()
