制作网格的高级方法
基础的2×2网格
我们可以使用subplots创建基本的2乘2图表域(Axes)网格。它返回一个图表(Figure)实例和一个图表域对象数组。可以访问这些图表域对象的方法将艺术家(artists)放置在它们上面;下面我们使用注释(annotate)方法作为例子,但plot、pcolormesh等其他方法一样。
·
·
·
·
·
·
·
·
·
·
·
·
·
·
ipython%matplotlib tkimport matplotlib.pyplot as plt
fig, axs = plt.subplots(ncols=2, nrows=2, figsize=(5.5, 3.5), layout="constrained")# add an artist, in this case a nice label in the middle...for row in range(2): for col in range(2): axs[row, col].annotate(f'axs[{row}, {col}]', (0.5, 0.5), transform=axs[row, col].transAxes, ha='center', va='center', fontsize=18, color='darkgrey')fig.suptitle('plt.subplots()')

我们要对很多图表域进行注释,因此让我们封装注释,而不是每次需要时都使用一大块注释代码:
·
·
·
def annotate_axes(ax, text, fontsize=18): ax.text(0.5, 0.5, text, transform=ax.transAxes, ha="center", va="center", fontsize=fontsize, color="darkgrey")
完整代码:
·
·
·
·
·
·
·
·
·
·
·
·
·
·
ipython%matplotlib tkimport matplotlib.pyplot as plt
def annotate_axes(ax, text, fontsize=18): ax.text(0.5, 0.5, text, transform=ax.transAxes, ha="center", va="center", fontsize=fontsize, color="darkgrey")fig, axs = plt.subplots(ncols=2, nrows=2, figsize=(5.5, 3.5), layout="constrained")# add an artist, in this case a nice label in the middle...for row in range(2): for col in range(2): annotate_axes(axs[row, col], f'axs[{row}, {col}]')fig.suptitle('plt.subplots()')
subplot_masaic也可以达到同样的效果,但返回类型是字典而不是数组,用户可以在其中赋予键有用的含义。下面我们提供了两个列表,每个列表代表一行,列表中的每个元素代表一列。
·
·
·
·
·
·
fig, axd = plt.subplot_mosaic([['upper left', 'upper right'], ['lower left', 'lower right']], figsize=(5.5, 3.5), layout="constrained")for k in axd: annotate_axes(axd[k], f'axd["{k}"]', fontsize=14)fig.suptitle('plt.subplot_mosaic()')
完整代码:
·
·
·
·
·
·
·
·
·
·
·
·
·
·
ipython%matplotlib tkimport matplotlib.pyplot as plt
def annotate_axes(ax, text, fontsize=18): ax.text(0.5, 0.5, text, transform=ax.transAxes, ha="center", va="center", fontsize=fontsize, color="darkgrey")
fig, axd = plt.subplot_mosaic([['upper left', 'upper right'], ['lower left', 'lower right']], figsize=(5.5, 3.5), layout="constrained")for k in axd: annotate_axes(axd[k], f'axd["{k}"]', fontsize=14)fig.suptitle('plt.subplot_mosaic()')

固定纵横比图表域的网格
图像或地图的常用固定纵横比坐标轴。然而,对于图表,如果它的图表域固定纵横比,那么就会对布局提出了挑战,因为图表域的大小受到了两组约束——它们符合图表,并且具有设置的纵横比。默认情况下,这会导致图表域之间存在较大间隙:
·
·
·
·
fig, axs = plt.subplots(2, 2, layout="constrained", figsize=(5.5, 3.5))for ax in axs.flat: ax.set_aspect(1)fig.suptitle('Fixed aspect Axes')
完整代码:
·
·
·
·
·
·
·
·
ipython%matplotlib tkimport matplotlib.pyplot as plt
fig, axs = plt.subplots(2, 2, layout="constrained", figsize=(5.5, 3.5))for ax in axs.flat: ax.set_aspect(1)fig.suptitle('Fixed aspect Axes')

解决这一问题的一种方法是将图表的纵横比更改为接近图表域的纵横比,但这需要反复尝试。Matplotlib还提供压缩布局(layout=“compressed”),它与简单网格一起使用时,会减少图表域之间的间隙。(mpl_toolkits还提供ImageGrid以实现类似的效果,但使用非标准图表域类)。
·
·
·
·
fig, axs = plt.subplots(2, 2, layout="compressed", figsize=(5.5, 3.5))for ax in axs.flat: ax.set_aspect(1)fig.suptitle('Fixed aspect Axes: compressed')
完整代码:
·
·
·
·
·
·
·
·
ipython%matplotlib tkimport matplotlib.pyplot as plt
fig, axs = plt.subplots(2, 2, layout="compressed", figsize=(5.5, 3.5))for ax in axs.flat: ax.set_aspect(1)fig.suptitle('Fixed aspect Axes: compressed')

跨越网格中行或列的图表域
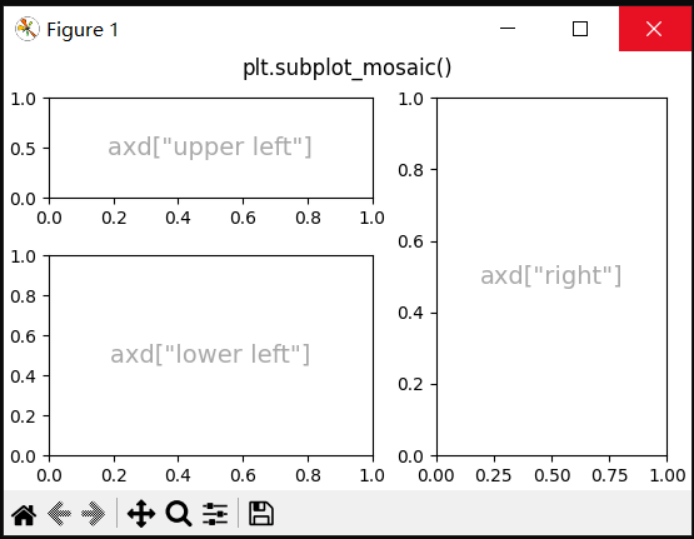
有时我们希望图表域跨越网格的行或列。实际上有多种方法可以实现这一点,但最方便的方法可能是通过重复其中一个键来使用subplot_mosaic:
·
·
·
·
·
·
fig, axd = plt.subplot_mosaic([['upper left', 'right'], ['lower left', 'right']], figsize=(5.5, 3.5), layout="constrained")for k in axd: annotate_axes(axd[k], f'axd["{k}"]', fontsize=14)fig.suptitle('plt.subplot_mosaic()')
完整代码:
·
·
·
·
·
·
·
·
·
·
·
·
·
·
ipython%matplotlib tkimport matplotlib.pyplot as plt
def annotate_axes(ax, text, fontsize=18): ax.text(0.5, 0.5, text, transform=ax.transAxes, ha="center", va="center", fontsize=fontsize, color="darkgrey")
fig, axd = plt.subplot_mosaic([['upper left', 'right'], ['lower left', 'right']], figsize=(5.5, 3.5), layout="constrained")for k in axd: annotate_axes(axd[k], f'axd["{k}"]', fontsize=14)fig.suptitle('plt.subplot_mosaic()')

有关如何使用GridSpec或subplot2grid执行相同操作的说明,请参见下文。
网格中的可变宽度或高度
当使用gridspec_kw关键字参数调用subplots和subplot_mosaic时,它们都允许网格中的行具有不同的高度和列具有不同的宽度。GridSpec接受的间距参数可以传递给subplots和subplot_mosaic:
·
·
·
·
·
·
·
·
gs_kw = dict(width_ratios=[1.4, 1], height_ratios=[1, 2])fig, axd = plt.subplot_mosaic([['upper left', 'right'], ['lower left', 'right']], gridspec_kw=gs_kw, figsize=(5.5, 3.5), layout="constrained")for k in axd: annotate_axes(axd[k], f'axd["{k}"]', fontsize=14)fig.suptitle('plt.subplot_mosaic()')
完整代码:
·
·
·
·
·
·
·
·
·
·
·
·
·
·
·
·
ipython%matplotlib tkimport matplotlib.pyplot as plt
def annotate_axes(ax, text, fontsize=18): ax.text(0.5, 0.5, text, transform=ax.transAxes, ha="center", va="center", fontsize=fontsize, color="darkgrey")
gs_kw = dict(width_ratios=[1.4, 1], height_ratios=[1, 2])fig, axd = plt.subplot_mosaic([['upper left', 'right'], ['lower left', 'right']], gridspec_kw=gs_kw, figsize=(5.5, 3.5), layout="constrained")for k in axd: annotate_axes(axd[k], f'axd["{k}"]', fontsize=14)fig.suptitle('plt.subplot_mosaic()')

嵌套图表域布局
有时需要两个或多个可能不需要相互关联的图表域网格。实现这一点最简单的方法是使用子图表(Figure.subfigures)。请注意,子图表布局是独立的,因此每个子图表中的图表域的脊不一定对齐。请参阅下文,了解使用GridSpecFromSubplotSpec实现相同效果的更详细方法。
·
·
·
·
·
·
·
·
·
·
fig = plt.figure(layout="constrained")subfigs = fig.subfigures(1, 2, wspace=0.07, width_ratios=[1.5, 1.])axs0 = subfigs[0].subplots(2, 2)subfigs[0].set_facecolor('0.9')subfigs[0].suptitle('subfigs[0]\nLeft side')subfigs[0].supxlabel('xlabel for subfigs[0]')
axs1 = subfigs[1].subplots(3, 1)subfigs[1].suptitle('subfigs[1]')subfigs[1].supylabel('ylabel for subfigs[1]')
完整代码:
·
·
·
·
·
·
·
·
·
·
·
·
·
·
ipython%matplotlib tkimport matplotlib.pyplot as plt
fig = plt.figure(layout="constrained")subfigs = fig.subfigures(1, 2, wspace=0.07, width_ratios=[1.5, 1.])axs0 = subfigs[0].subplots(2, 2)subfigs[0].set_facecolor('0.9')subfigs[0].suptitle('subfigs[0]\nLeft side')subfigs[0].supxlabel('xlabel for subfigs[0]')
axs1 = subfigs[1].subplots(3, 1)subfigs[1].suptitle('subfigs[1]')subfigs[1].supylabel('ylabel for subfigs[1]')

也可以使用嵌套列表调用subplot_mosaic生成嵌套图表域。该方法不使用subfigures,如上所述,因此无法添加每个子图表的suptitle和supxlabel等。相反,它是下面描述的subgridspec方法的方便包装。
·
·
·
·
·
·
·
·
inner = [['innerA'], ['innerB']]outer = [['upper left', inner], ['lower left', 'lower right']]
fig, axd = plt.subplot_mosaic(outer, layout="constrained")for k in axd: annotate_axes(axd[k], f'axd["{k}"]')
完整代码:
·
·
·
·
·
·
·
·
·
·
·
·
·
·
·
·
ipython%matplotlib tkimport matplotlib.pyplot as plt
def annotate_axes(ax, text, fontsize=18): ax.text(0.5, 0.5, text, transform=ax.transAxes, ha="center", va="center", fontsize=fontsize, color="darkgrey")
inner = [['innerA'], ['innerB']]outer = [['upper left', inner], ['lower left', 'lower right']]
fig, axd = plt.subplot_mosaic(outer, layout="constrained")for k in axd: annotate_axes(axd[k], f'axd["{k}"]')

subplots:
https://matplotlib.org/stable/api/_as_gen/matplotlib.pyplot.subplots.html#matplotlib.pyplot.subplots
Figure:
https://matplotlib.org/stable/api/figure_api.html#matplotlib.figure.Figure
Axes:
https://matplotlib.org/stable/api/axes_api.html#matplotlib.axes.Axes
annotate:
https://matplotlib.org/stable/api/_as_gen/matplotlib.axes.Axes.annotate.html#matplotlib.axes.Axes.annotate
plot:
https://matplotlib.org/stable/api/_as_gen/matplotlib.axes.Axes.plot.html#matplotlib.axes.Axes.plot
pcolormesh:
https://matplotlib.org/stable/api/_as_gen/matplotlib.axes.Axes.pcolormesh.html#matplotlib.axes.Axes.pcolormesh
subplot_mosaic:
https://matplotlib.org/stable/api/_as_gen/matplotlib.pyplot.subplot_mosaic.html#matplotlib.pyplot.subplot_mosaic
ImageGrid:
https://matplotlib.org/stable/api/_as_gen/mpl_toolkits.axes_grid1.axes_grid.ImageGrid.html#mpl_toolkits.axes_grid1.axes_grid.ImageGrid
GridSpec:
https://matplotlib.org/stable/api/_as_gen/matplotlib.gridspec.GridSpec.html#matplotlib.gridspec.GridSpec
subplot2grid:
https://matplotlib.org/stable/api/_as_gen/matplotlib.pyplot.subplot2grid.html#matplotlib.pyplot.subplot2grid
Figure.subfigures:
https://matplotlib.org/stable/api/figure_api.html#matplotlib.figure.Figure.subfigures
GridSpecFromSubplotSpec:
https://matplotlib.org/stable/api/_as_gen/matplotlib.gridspec.GridSpecFromSubplotSpec.html#matplotlib.gridspec.GridSpecFromSubplotSpec
subgridspec:
https://matplotlib.org/stable/api/_as_gen/matplotlib.gridspec.SubplotSpec.html#matplotlib.gridspec.SubplotSpec.subgridspec